
ROI OPTIMIZER
A cloud-based computational tool that automates programmatic distribution and optimizes financial performance for complex high-rise developments in real-time.

The Business Advantage of Market Intelligence
Empower your real estate development strategy with a cloud-based computational engine that synchronizes architectural form with market reality.
Our platform automates programmatic distribution, instantly calculating construction costs and projected market values to ensure every design iteration is rigorously backed by financial intelligence, maximizing your project's overall return on investment.


Assessing the Variables Bottleneck
The modern real estate development landscape demands agility, yet traditional feasibility studies remain notoriously rigid, siloed, and slow.
Architects and developers frequently struggle to visualize how shifting programmatic percentagessuch as increasing residential area at the expense of commercial spacerectly impacts the overall Return on Investment (ROI).
This disconnect occurs because architectural geometry and financial modeling typically exist in separate software ecosystems, requiring manual data transfer and time-consuming recalculations for every single design iteration. Consequently, teams are unable to explore the full spectrum of programmatic permutations, leaving significant value on the table.
Furthermore, as urban high-rise projects grow in complexity, the sheer volume of data involved in calculating floor-by-floor efficiencies, localized construction costs, and shifting market values becomes overwhelming. Without a centralized, dynamic system, stakeholders are forced to rely on static reports that are often outdated by the time they are reviewed.
This sluggish workflow hinders the ability to pivot swiftly in response to volatile market conditions or strict zoning requirements. When manual financial modeling cannot keep pace with the iterative nature of the design process, the result is a compromised building configuration that fails to achieve its maximum economic potential.
The industry lacks a democratized tool that brings complex computational logic directly into a collaborative environment, accessible to users who may not possess specialized parametric design software.
The challenge was clear: we needed to build a responsive, data-driven bridge between spatial constraints and commercial viability, transforming an opaque process into a transparent, interactive, and highly optimized strategic advantage for developers and architects alike.
The computational Logic Support
To solve the inherent disconnect between architectural design and financial feasibility, Archificials developed an approach centered on "Geometry as a Service". We recognized that the key to unlocking real-time optimization lay in migrating advanced parametric logic from desktop-bound software to a highly accessible, cloud-based web application.
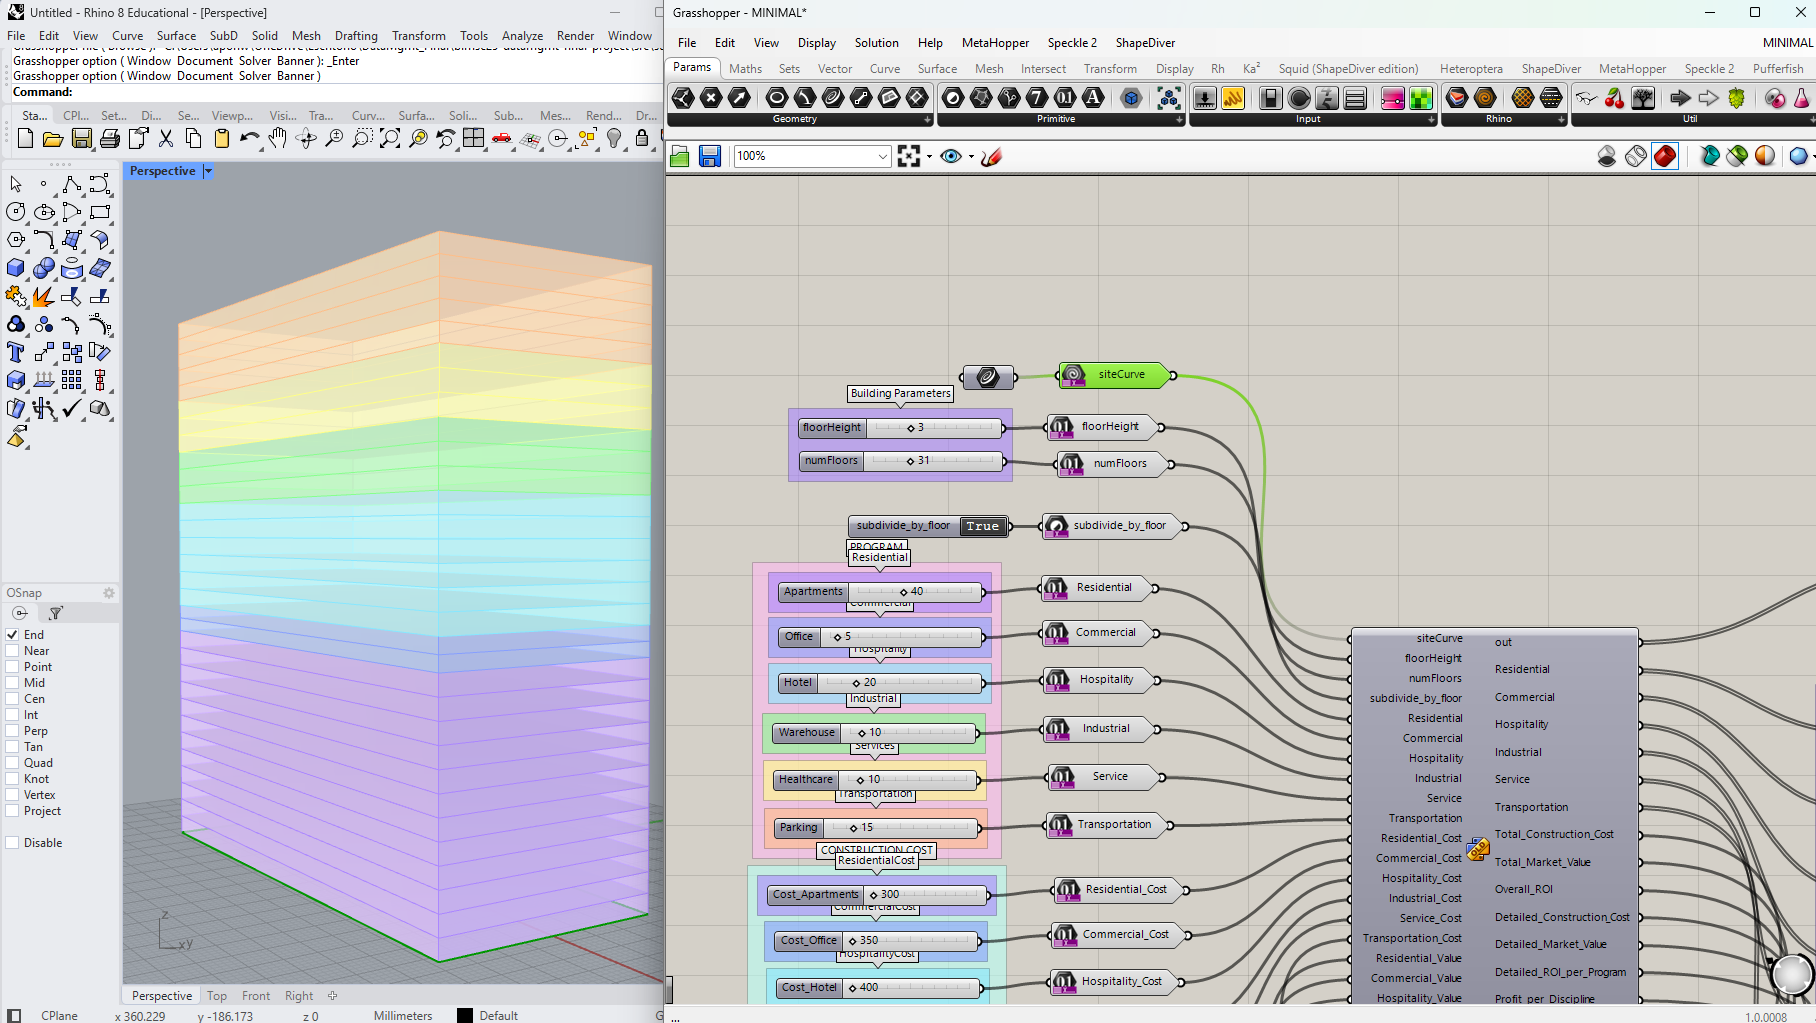
By leveraging Rhino Compute, we established a robust pipeline that allows complex 3D geometry and Grasshopper definitions to be processed entirely on the server side. This eliminates the need for stakeholders to possess specialized software to interact with the model.
Our methodology focused on creating a dual-input system to maximize flexibility
First, we developed a baseline pathway where users can define simple building parameterssuch as footprint curves, floor counts, and respective heightsto instantly generate an analytical massing.
Second, we engineered an integration pathway allowing users to import established BIM models, such as our proprietary Hyperbuilding, to read each level's footprint as the primary geometric input.
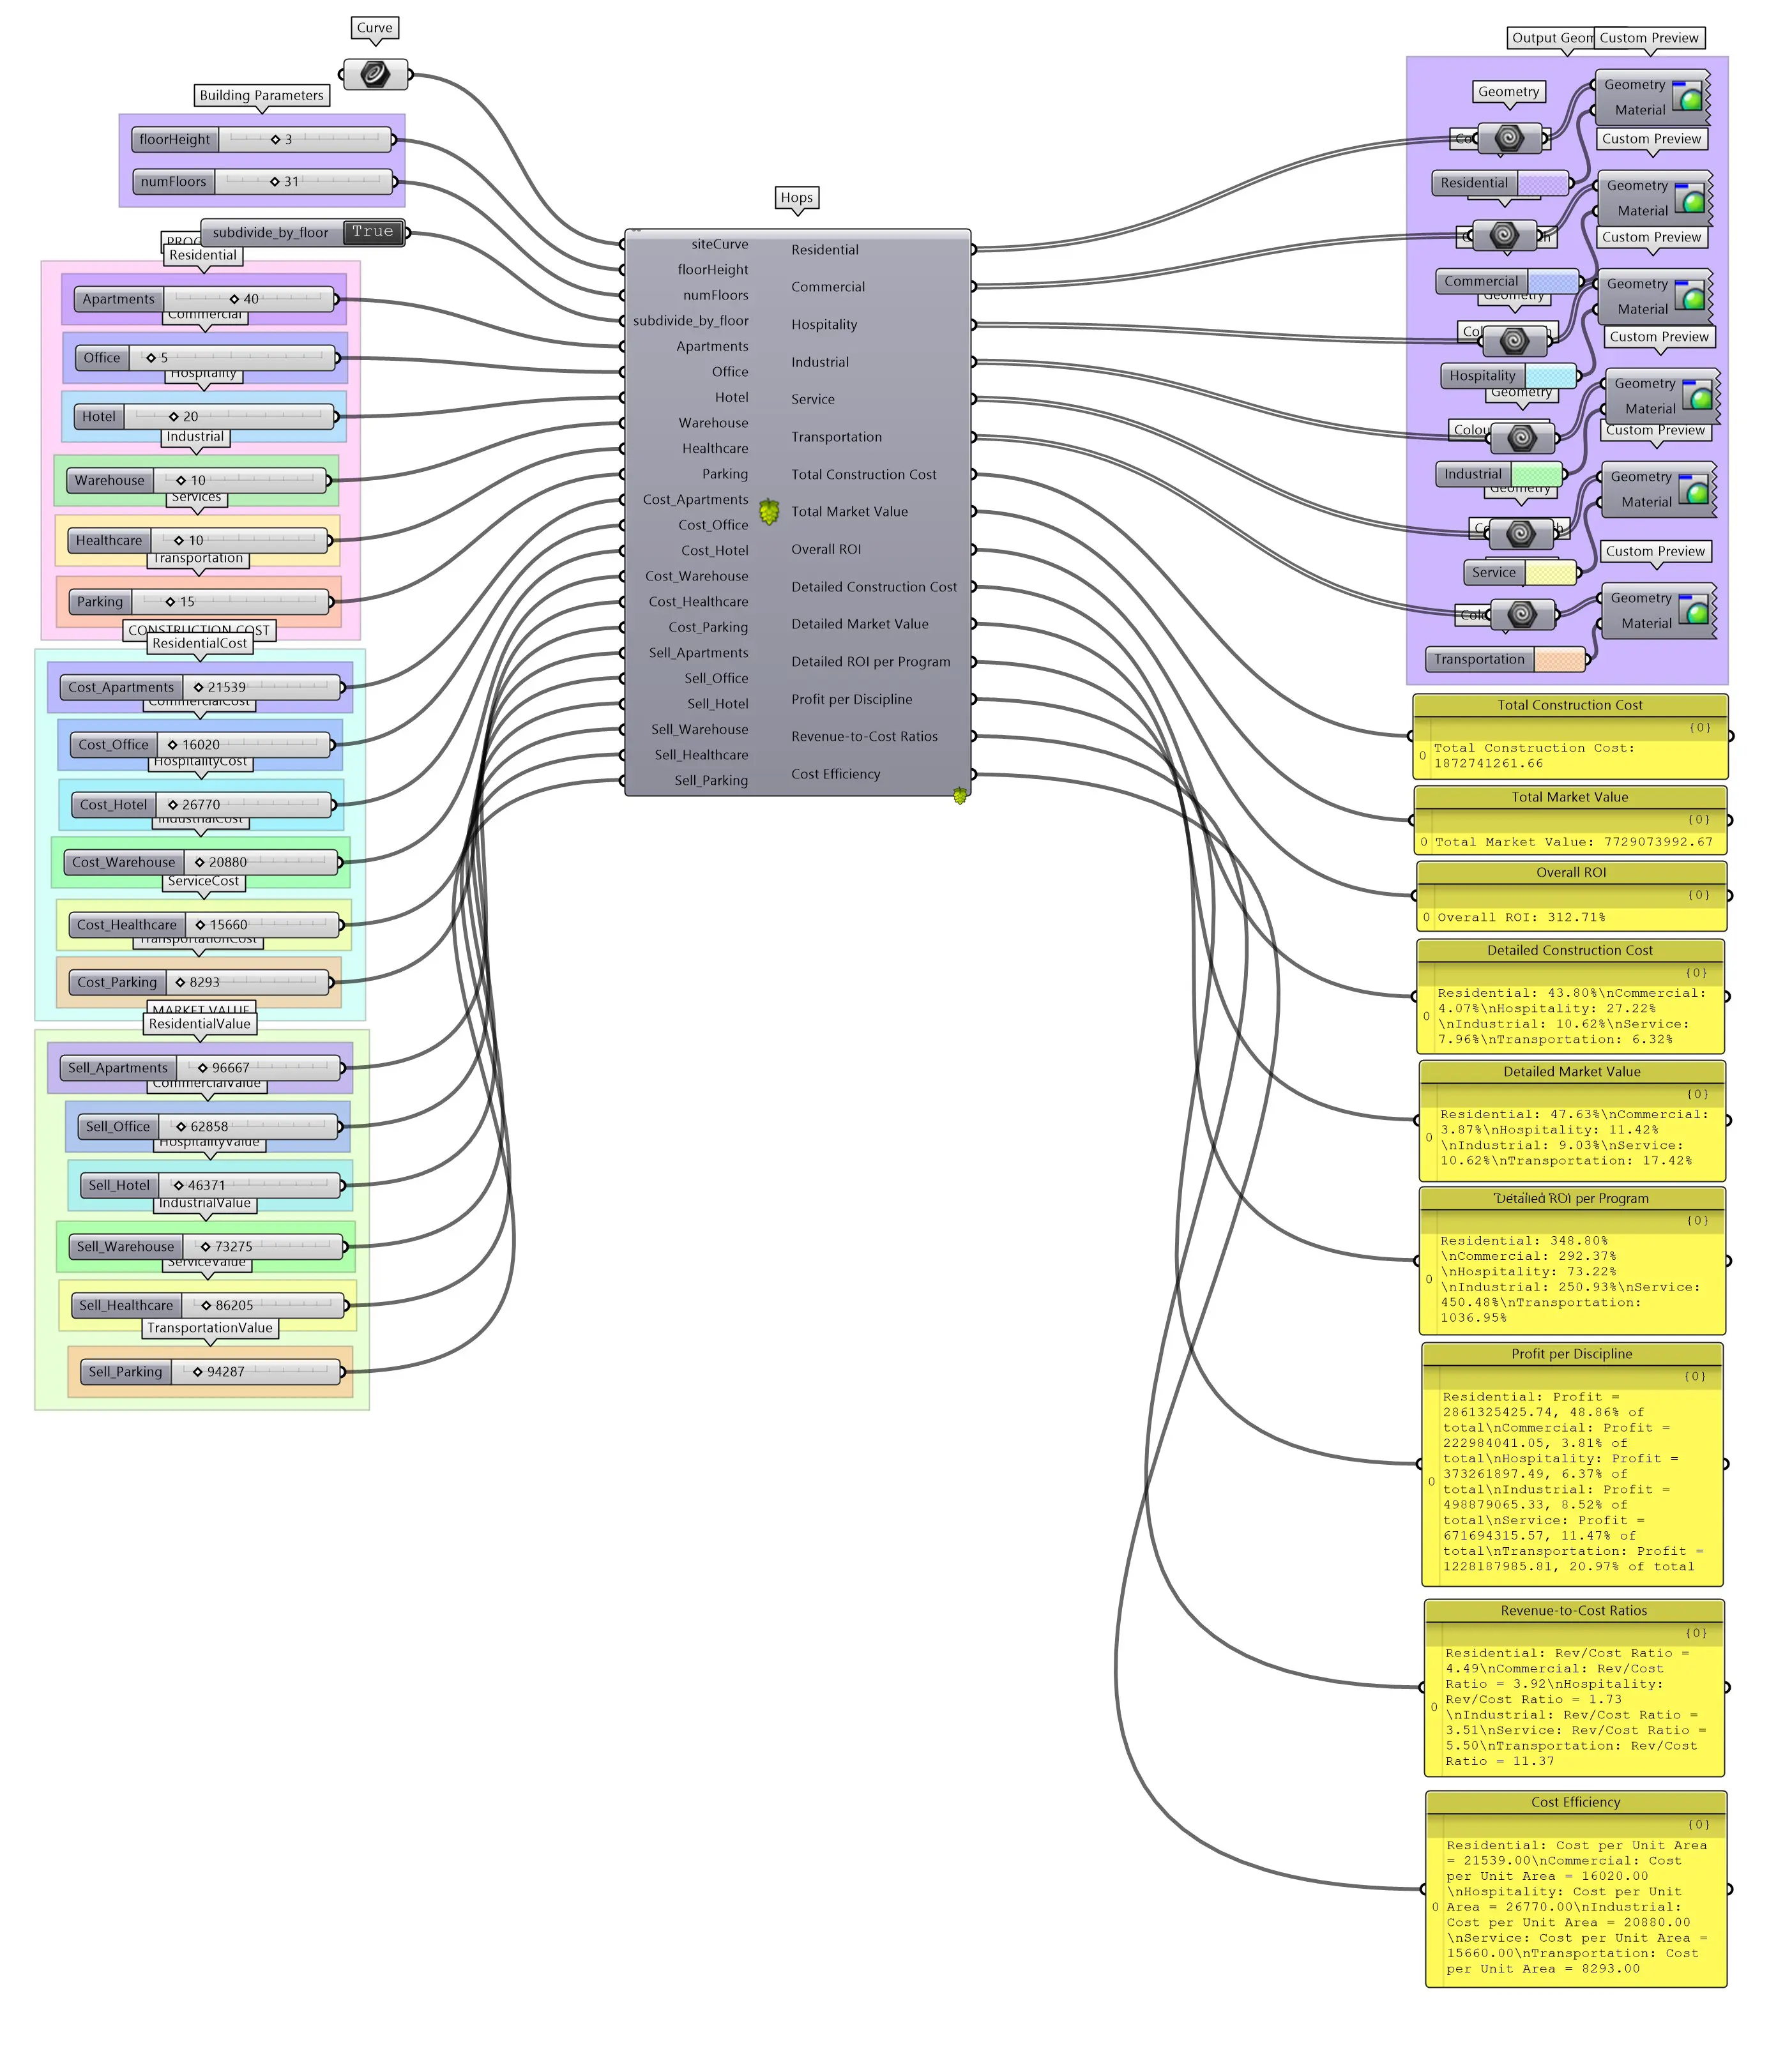
Crucially, we paired this geometric engine with a custom Python script designed to handle complex data management. This script processes varied programmatic percentages and distributes them intelligently across the building's volume.
To ground this distribution in commercial reality, we integrated localized financial data sets, such as current RS Means construction costs and specific market values for the Austin Tokyo markets.
The result is an approach that dynamically binds every square meter of geometry to a live financial metric. By wrapping this sophisticated backend in an intuitive Vue.js frontend, we provided a seamless, interactive dashboard where programmatic shifts are instantly reflected in a comprehensive suite of financial performance metrics, offering unprecedented clarity and control.
A Layered Approach
The core system is a multi-layered computational framework that dynamically synchronizes three-dimensional building geometry with multi-variable financial data. Hosted on a responsive web interface, it processes user-defined inputs or existing BIM models through custom Python algorithms and Rhino Compute servers. This seamless integration delivers real-time programmatic distribution, granular cost analysis, and return on investment optimization directly to the browser.

Geometric Input Flexibility:
The system accepts baseline parameters to generate massings on the fly, or it can ingest established building models to read detailed level-by-level footprints as the primary geometric data source.

Programmatic Distribution Engine:
A sophisticated p script automatically allocates diverse project programsncluding residential, commercial, hospitality, services, and industrial spacescoss the building volume based on precise percentage targets inputted by the user via the dashboard.

Financial Data Integration:
The system seamlessly merges spatial data with localized financial metrics. By incorporating real-time construction costs from RS Means reports and current market values, it grounds architectural geometry in accurate, actionable commercial reality.
Real-Time Analytical Dashboard:
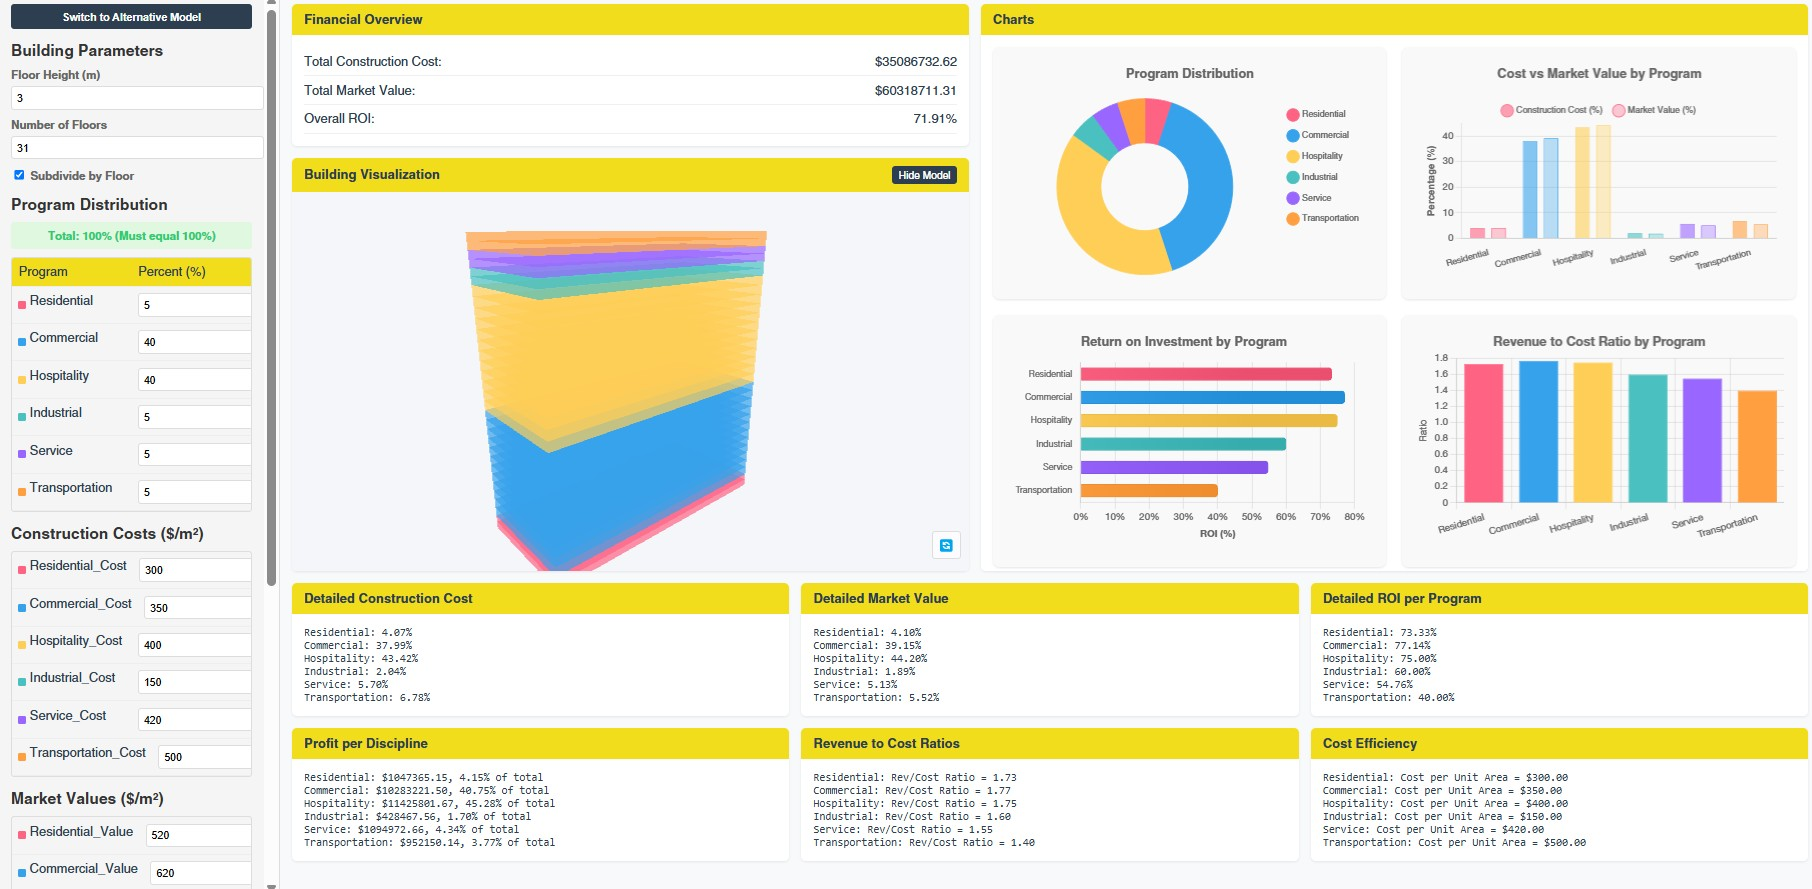
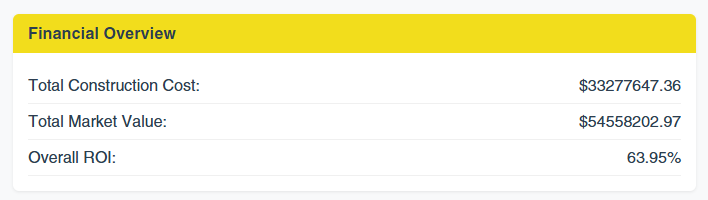
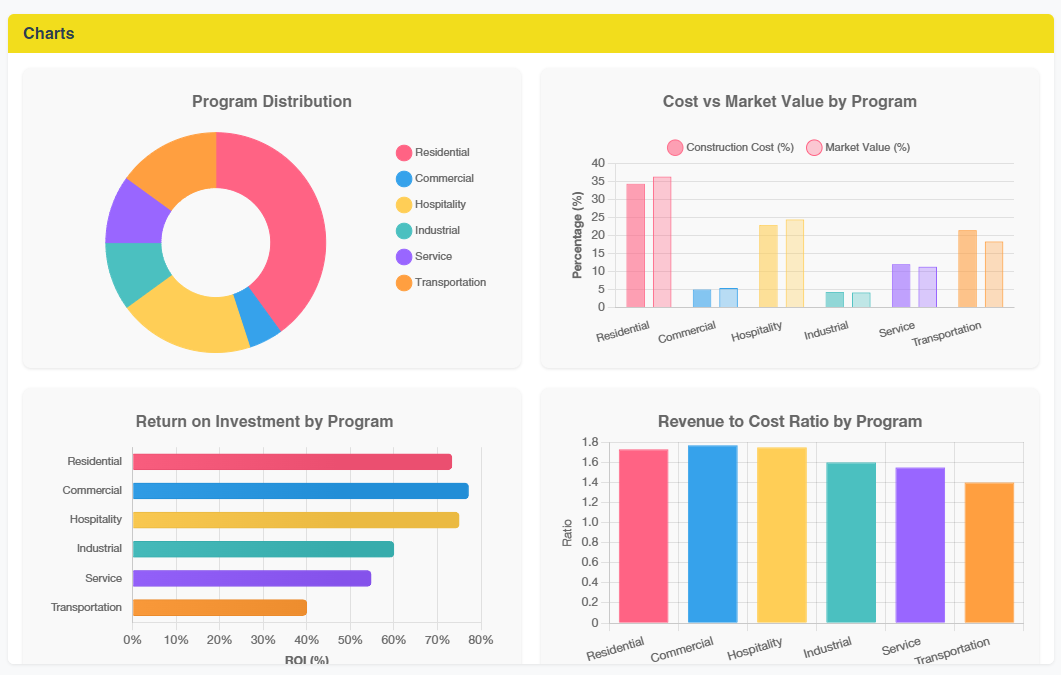
A centralized interface provides an immediate overview of total construction costs, market values, and an estimated Return on Investment. Detailed interactive charts offer a granular breakdown of profit per discipline, revenue-to-cost ratios, and overall cost efficiency for every element.
Automated ROI Optimization:
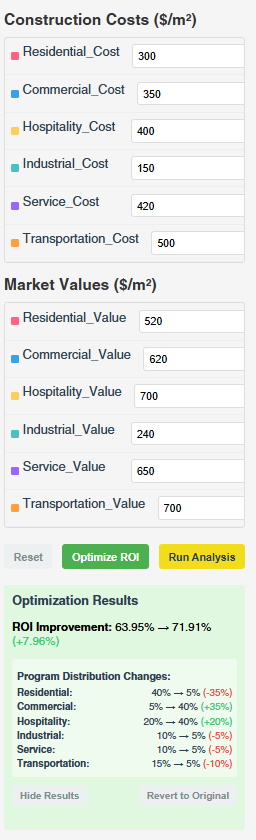
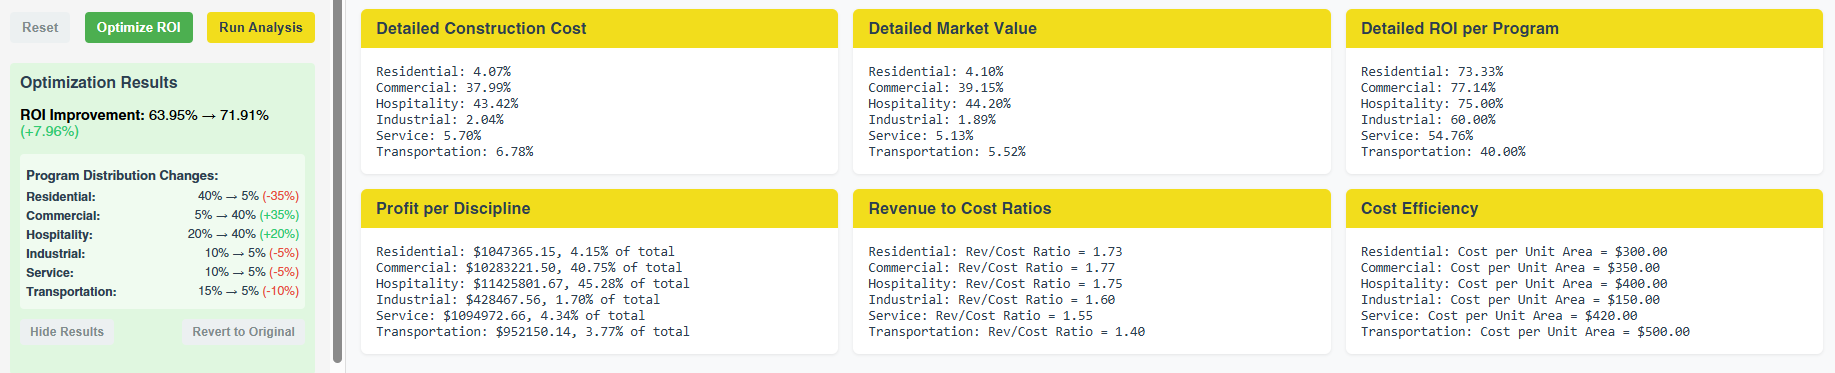
At the push of a button, the algorithm runs iterative tests against the current spatial configuration. It analyzes given construction costs and localized market values to automatically redistribute the internal program throughout the building. The engine outputs the most financially efficient architectural configuration, providing a detailed breakdown of how percentages shifted to maximize the overall return on investment
Deployment:
The overarching architecture of this system democratizes complex computational design. By leveraging cloud infrastructure to handle heavy geometric processing, it removes traditional software barriers, allowing developers and urban planners to engage directly with parametric models through a standard web browser.
The backend logic ensures that every shift in programmatic percentage or localized cost data triggers an immediate recalculation of the building's physical massing and its corresponding financial viability. This creates a tightly knit feedback loop where design and economics are synchronized perfectly.
Whether a team is evaluating a simple extruded footprint in the Austin market or running optimizations on our proprietary Hyperbuilding models in the Tokyo market, the system wrapper provides a consistent, high-performance, and deeply analytical user experience.
It turns raw data into actionable real estate intelligence, serving as a comprehensive tool that bridges the gap between creative architectural vision and rigorous financial execution.
.webp)
.webp)
.webp)
The Field Test
To rigorously validate the capabilities of our Data-Driven Feasibility Engine, we conducted comprehensive testing using both baseline geometric inputs and complex architectural models.
The primary goal of these tests was to ensure the Python algorithms and Rhino Compute integration could seamlessly handle high-density data processing while delivering accurate, real-time financial optimizations.
The first phase of testing involved the default input methodology. We defined basic building parameters, inputting a specific footprint curve, floor count, and respective heights to generate a standard high-rise massing. We injected a complex programmatic mix consisting of residential, commercial, hospitality, industrial, and transportation sectors.
To test the financial engine's accuracy, we incorporated construction costs derived from the latest RS Means report for the Austin, Texas market, alongside current commercial market values. The system successfully distributed the programs across the generated floors and instantly computed the baseline financial metrics. Crucially, we then initiated the "Optimize ROI" function. The computational algorithm ran a series of rapid iterations, testing various programmatic distributions against the Austin financial data. The test was a resounding success: the system automatically redistributed the programs, visibly shifting the building's internal configuration in the 3D viewer, and provided a detailed summary of how the percentages changed to achieve a substantially higher Return on Investment.
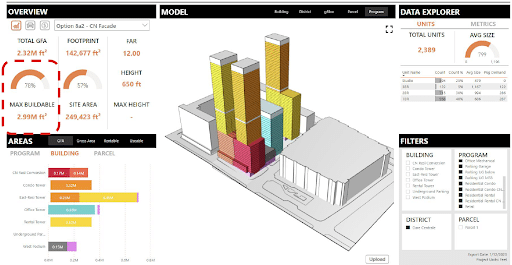
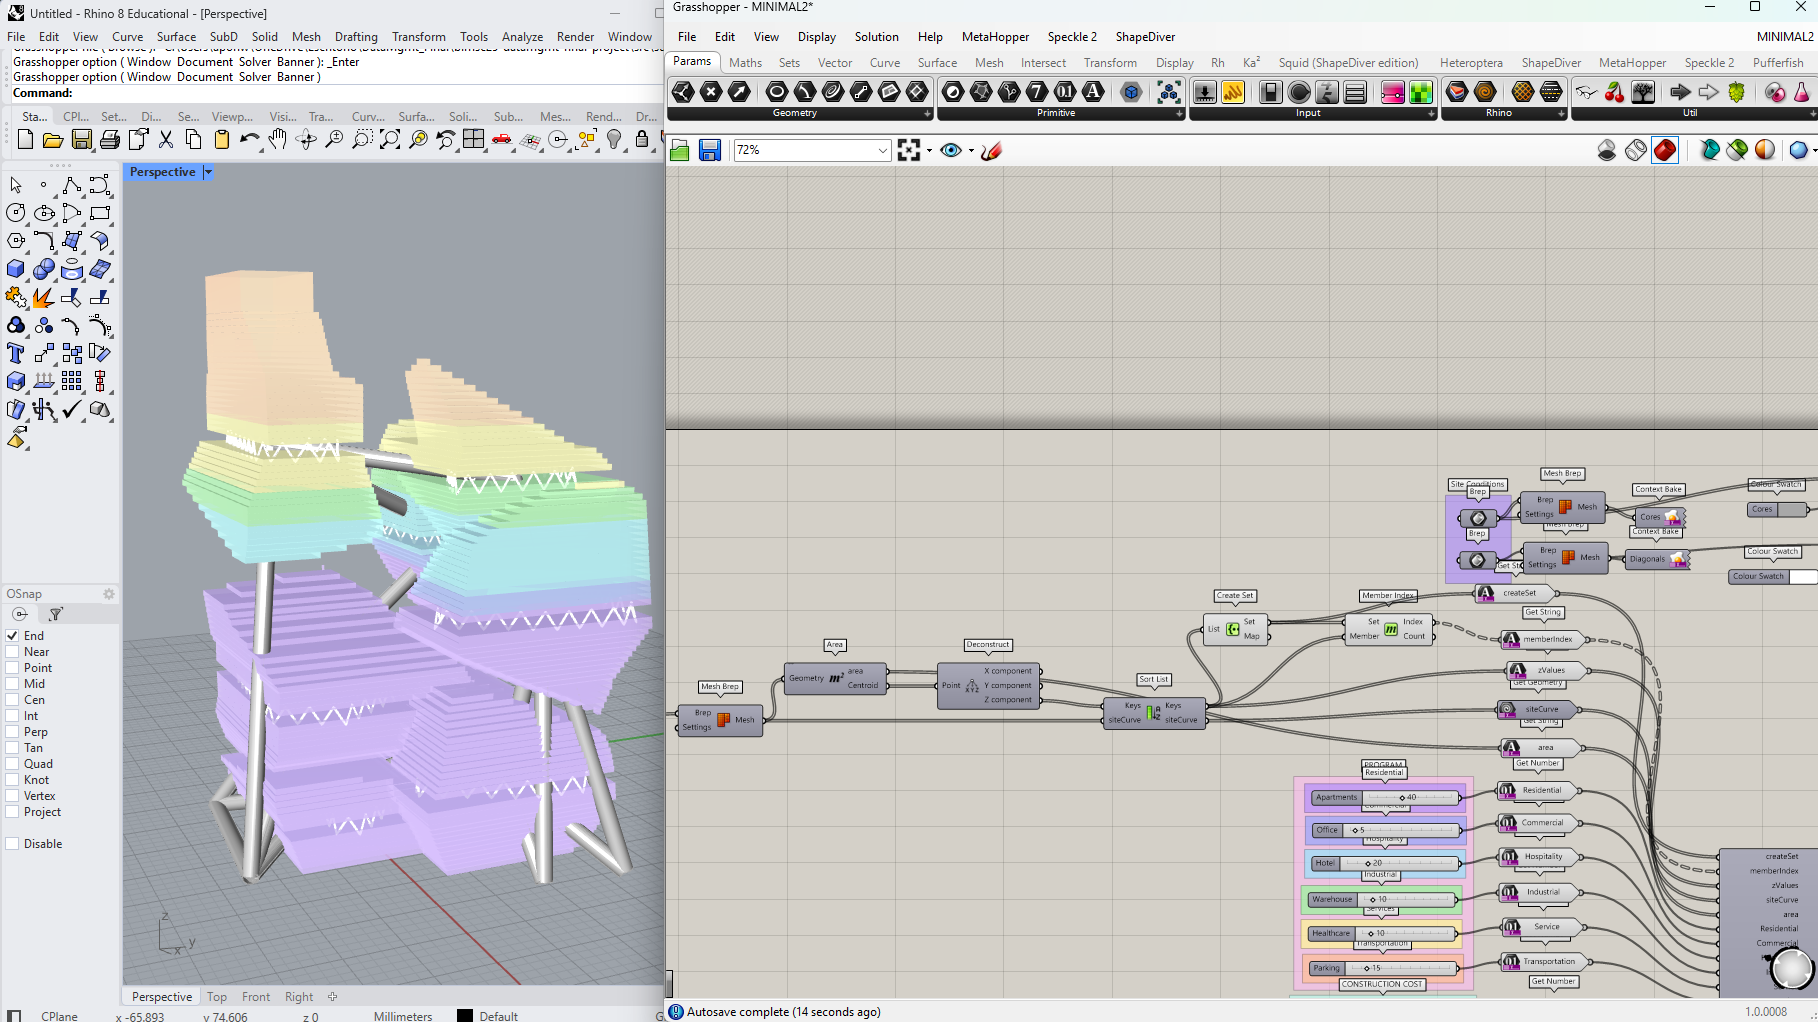
The second, far more demanding phase of testing pushed the system to its limits by utilizing an alternative input method. For this, we integrated our proprietary model. This model represents a massive, highly complex mixed-use development with non-linear geometry spanning multiple levels. Loading this model tested the cloud server's capacity to read individual level footprints as the main geometric input.
To provide a different economic context, we applied current construction costs and market value data specific to the Tokyo real estate market, where Hyperbuilding is located.Despite the heavier geometry and vast square meterage to calculate, the Vue.js interface and Grasshopper backend performed flawlessly. The system mapped the programmatic percentages across the intricate floorplates of the Hyperbuilding. The financial overview section populated with the Tokyo-specific metrics, detailing the total construction cost, total market value, and the initial ROI for the complex structure.
The true stress test occurred when we ran the optimization algorithm on the Hyperbuilding model. Given the scale of the building, the computational load was immense. The system processed the permutations, evaluating the Tokyo market data against the complex spatial constraints. Once the analysis concluded, the engine successfully outputted an optimized programmatic distribution. The visualizer updated to reflect the new internal logic, and the detailed breakdown charts provided granular insights into the revenue-to-cost ratios per discipline. Most importantly, the optimization result overview clearly demonstrated which programmatic disciplines experienced a strategic increase or decrease in area to maximize the final financial return.
By bridging the gap between design and financial analysis through cutting-edge cloud architecture, we verified that developers can rely on this tool to extract maximum value from any given site constraints, solidifying its place as a critical asset in modern real estate strategy.
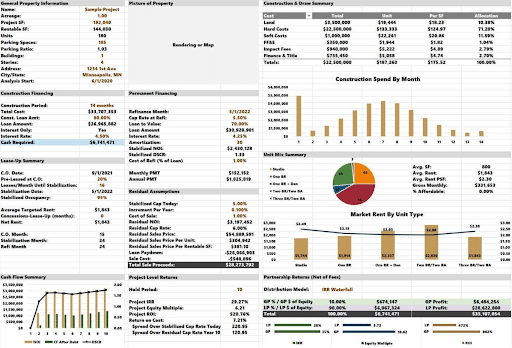
Instantaneous Financial Visualization
The integration of the Grasshopper backend with the web interface allowed for real-time calculation and visualization of crucial financial metrics. Stakeholders could immediately view the total estimated construction costs, overall market values, and initial return on investment for any given architectural configuration. This immediate feedback loop eliminated the traditional waiting periods associated with manual feasibility studies, empowering teams to assess the viability of different programmatic mixessuch as balancing residential units against commercial office spacewith unprecedented speed and graphical clarity.
Algorithmic ROI Maximization
The successful deployment of the "Optimize ROI" function proved that computational logic can actively improve real estate profitability. By running iterative tests against localized market data, the system automatically identified the most efficient way to distribute programs across the building volume. The result was a mathematically optimized spatial configuration that increased the projected return on investment, providing developers with an actionable, data-backed roadmap for finalizing their building's internal layout to achieve the highest possible economic efficiency.
Seamless Complex Model Integration
Testing with the Hyperbuilding A model demonstrated the platform's robust capacity to handle massive, non-linear geometric datasets. The system successfully read complex, level-by-level footprints directly from the imported model, proving that the tool is fully scalable for advanced, late-stage development projects. Despite the heavy computational load, the cloud-based infrastructure maintained high performance, accurately mapping varied programmatic percentages across distinct floorplates. This result validates the engine as a versatile solution capable of seamlessly transitioning from simple early-stage massing exercises to rigorous programmatic auditing of intricate, large-scale designs.
Granular Economic Transparency
The platform delivered highly detailed, discipline-specific financial breakdowns that go far beyond standard top-line estimates. The results generated a comprehensive suite of charts and data points, including profit per discipline, precise revenue-to-cost ratios for each program type, and overall cost efficiency metrics. By isolating the financial performance of individual sectorslike hospitality versus industrial spacethe engine provided stakeholders with a transparent, highly granular understanding of where value is created or lost. This depth of information is critical for mitigating risk and securing investment confidence in competitive real estate markets.

What This Means for The Future of Real Estate
The commercial impact of the Archificials Data-Driven Feasibility Engine is transformative for the real estate development sector, fundamentally altering how architectural projects are conceptualized and financially validated.
By democratizing access to complex parametric logic through a standard web browser, we have removed the bottlenecks that slow down the early phases of design and investment analysis.
Developers are no longer reliant on disconnected workflows where architectural teams and financial analysts work in silos. Instead, this engine provides a dynamic, living dashboard that instantly quantifies the commercial value of spatial decisions.
The ability to input localized metricssuch as RS Means construction costs for the Austin market or specific valuation data for Tokyoensures that every optimization is grounded in harsh economic reality. When developers can instantly visualize how a programmatic shift affects their overall Return on Investment, they gain a massive competitive advantage. They can pivot quickly in response to zoning changes or shifting market demands without waiting weeks for new massings to be manually reconciled.
Furthermore, the optimization feature acts as an automated strategic advisor, uncovering highly profitable programmatic configurations that human teams might overlook due to the mathematical complexity of multi-variable spatial distribution.
This granular transparencyshowcasing exact revenue-to-cost ratios and profit margins per disciplineis invaluable when presenting projects to stakeholders, investors, or city planning boards. It builds immediate trust through objective data.
Ultimately, this tool mitigates financial risk, dramatically accelerates the due diligence timeline, and ensures that the final architectural form is mathematically engineered to achieve its maximum possible economic yield in any market.
Towards a Financially Responsible Future in Architecture.
Implementing this cloud-based feasibility engine within the Architecture, Engineering, and Construction industry represents a major leap toward fully integrated, data-driven design.
For urban planners, real estate developers, and large-scale architectural practices, this tool seamlessly slots into the earliest stages of the project lifecycle. It allows teams to conduct rapid massing studies and programmatic audits before significant capital is expended on detailed schematic design.
The system's capacity to toggle between basic parametric inputs and complex, established BIM modelslike our Hyperbuilding assetsensures that it remains useful from day one of conceptualization right through to final refinement. Furthermore, because the heavy computational lifting is handled via Rhino Compute on the server side, industry implementation requires zero specialized hardware or expensive software licenses for the end-user. A developer can review and optimize a high-rise configuration on a tablet during a board meeting.
By standardizing the way spatial data and financial metrics are merged, the tool encourages a collaborative implementation strategy. Cost estimators, lead architects, and financial directors can all operate from the exact same real-time dashboard, eliminating communication errors.
Deploying this engine ensures that firms remain at the bleeding edge of prop-tech, transforming feasibility analysis into a proactive, high-value strategy for continuous portfolio optimization.
FAQ
1. How does the application process and visualize the financial data of the building?
The application utilizes a powerful Grasshopper and Python backend to process all financial data.
Once the user defines the geometric inputs and sets the programmatic percentages, the system ingests specific financial metrics. Users manually input the estimated construction costs per square meter and the current market values for each program type.
The Python script algorithmically distributes the programs across the building's floorplates based on the user's percentages. Simultaneously, it calculates the financial performance.
This data is instantly pushed to the frontend, where the user is presented with a centralized financial overview displaying total construction costs, total market value, and overall ROI.
Additionally, the interface features interactive charts and detailed sections that break down the profit per discipline, the revenue-to-cost ratio for each program, and total cost efficiency. This ensures that the user has a high-level summary and granular, discipline-specific financial data readily available for analysis.
What are the different methods available for inputting architectural geometry into the feasibility engine?
There are two primary methods for inputting architectural geometry into our feasibility engine, designed to accommodate different stages of the design process.
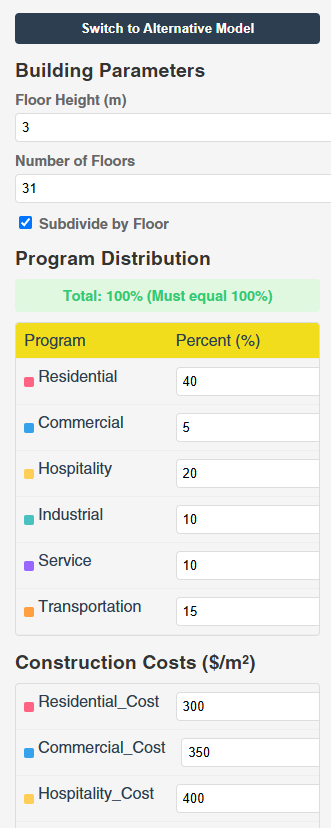
The standard method is ideal for early-stage conceptualization. Users manually define basic building parameters directly within the input menu on the left side of the interface. This involves providing a building footprint via a curve, setting the desired number of floors, and defining the respective floor heights. The system uses this baseline data to dynamically generate a 3D massing for analysis.
The alternative method is tailored for more advanced stages of design and utilizes the "switch to the alternative model" feature. This allows users to bypass manual parameter entry and instead upload a pre-existing building modelsuch as our proprietary Hyperbuilding When utilizing this method, the system directly reads the specific footprint of each individual level from the imported 3D model to establish the main geometric input. While heavier models take slightly longer to load, this method allows for precise programmatic distribution and financial calculation across intricate, non-linear floorplates, seamlessly integrating with established BIM workflows.
How does the automated optimization feature improve the project's overall return on investment?
The automated optimization feature is a core component designed to maximize a project's financial potential.
Located at the bottom of the left-hand panel, the "Optimize ROI" button triggers a sophisticated computational algorithm. When activated, the system takes the user's current building configuration, the specified construction costs, and the localized market values, and runs a vast series of iterative simulations.
During these simulations, the algorithm rapidly tests different ways to distribute the selected programs across the available floor space to identify which distribution yields the highest profitability.
Once the analysis is complete, the system automatically redistributes the program within the 3D building model based on the cost and market estimates. It updates all financial charts to reflect the newly optimized configuration.
Furthermore, it generates an optimization result overview at the bottom of the panel, explicitly detailing how the programmatic percentages were changedshowing exactly which disciplines experienced an increase or decrease in areato successfully achieve the improved Return on Investment.
Can the system utilize localized financial data for different global real estate markets?
Absolutely!
A primary strength of the Data-Driven Feasibility Engine is its highly adaptable financial input system, which allows it to be utilized for projects located in any global real estate market.
The platform empowers the user to inject highly localized, current market data directly into the calculation pipeline. During a standard massing test, a user can manually input current construction costs per square meter and corresponding programmatic market values derived from localized reports, such as the RS Means report for the Austin, Texas market.
Conversely, when evaluating a different project, the user can easily update the input fields with construction costs and real estate market values specific to th market. The Python backend instantly recalibrates its programmatic distribution and ROI optimization algorithms based on whichever local dataset is provided.
This extreme flexibility ensures that developers are always generating feasibility studies and programmatic optimizations that are rigorously grounded in the specific economic realities of their project's physical location.
Do users need specialized computational design software to operate this feasibility engine?
No, users do not need any specialized computational design software, powerful hardware, or prior coding experience to operate this tool.
One of the main objectives of developing this platform was to democratize access to advanced computation and take advantage of the ubiquity of computing.
We achieved this by leveraging tools that help design interactive 3D web applications and transitioning the heavy processing logic onto the cloud. The complex Grasshopper definitions and Python scripts that drive the geometric generation and financial calculations run entirely on the backend utilizing Rhino Compute, an open-source project that allows running Rhino on the cloud.
Therefore, all a user needs to access the engine is a standard web browser and an internet connection from any device. Stakeholders can seamlessly interact with the tool, manipulate inputs via the web interface, and instantly visualize 3D architectural changes. By eliminating the steep learning curve typically associated with parametric design, the engine ensures all project partners can actively participate.