
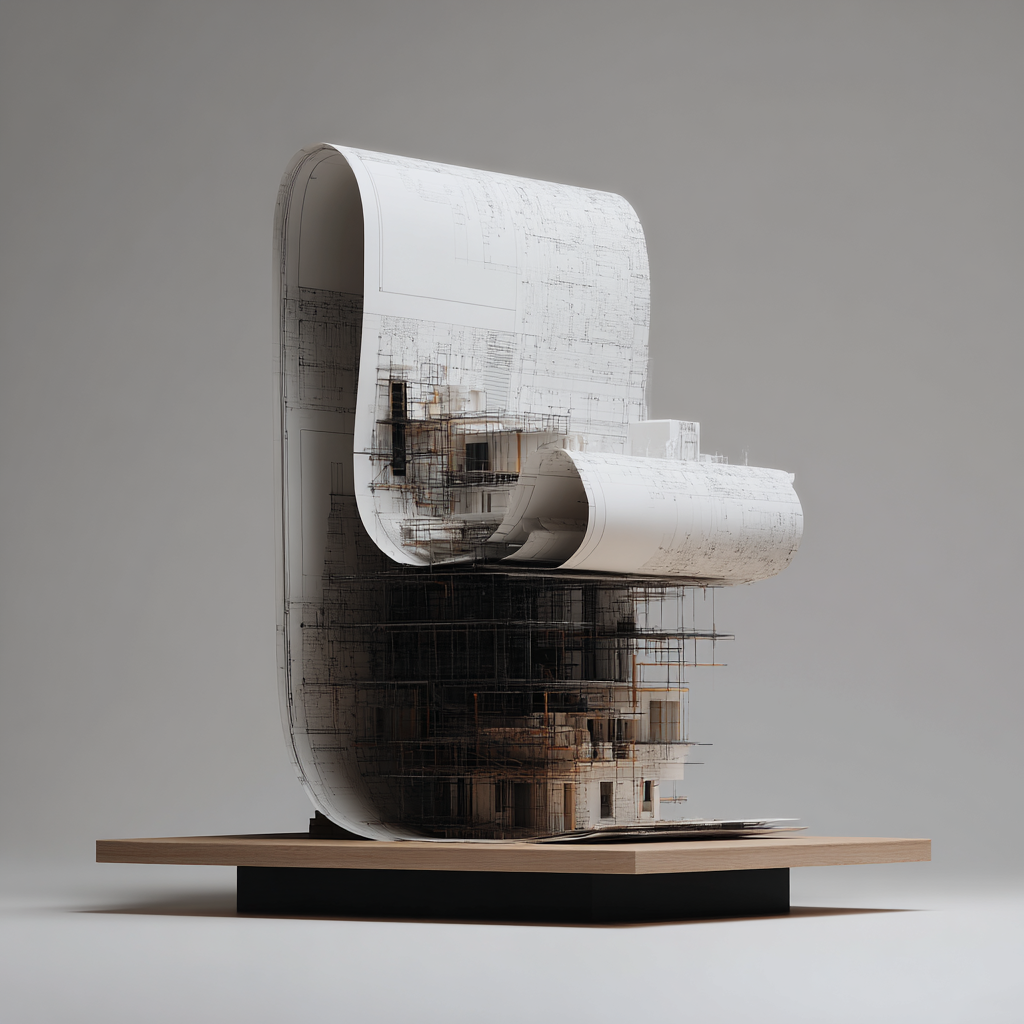
INTEGRATIVE PERFORMANCE
An advanced computational tool bridging parametric environments with native Revit capabilities to transform abstract multi-criteria performance data into intuitive BIM visualizations.
Real Bi-Directional Design Intelligence
Transform your complex multi-criteria performance data into intuitive, real-time visual feedback directly within Revit. Our computational integration bridges Grasshopper and BIM, automating gradient-based material overrides and custom tagging to provide immediate, actionable design intelligence for stakeholders, ensuring every architectural decision is grounded in rigorous, fully visualized performance metrics.


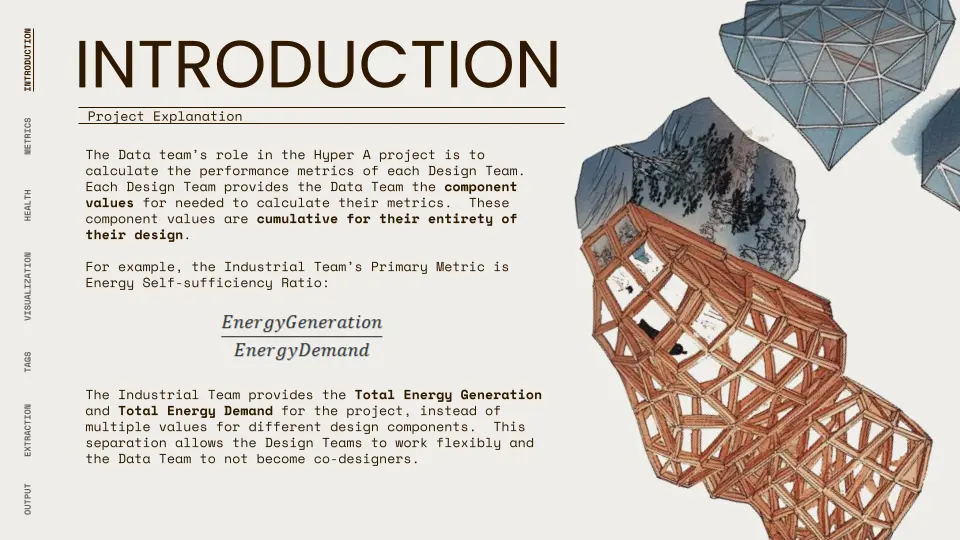
The Problem With Specialized Silo Thinking
Modern large-scale architecture demands rigorous performance tracking across highly specialized, separate disciplines.
Facade teams monitor daylight factors, industrial teams track energy generation, and structural teams calculate embodied carbon efficiencies. However, the fundamental problem lies in the deeply siloed nature of this data.
These teams produce cumulative component values that are conceptually different and measured in entirely different units. In traditional workflows, aggregating this data to understand the holistic health of a project is a sluggish, manual process heavily reliant on disconnected spreadsheets.
Consequently, abstract performance metrics remain isolated from the actual three-dimensional building model. When developers and lead architects review a Revit model, they see the geometric form, but they cannot instantly visualize the underlying performance logic.
This disconnect prevents real-time, data-driven decision-making. If the facade's panel optimization drops, or the structural material efficiency decreases, it takes weeks for those isolated metrics to be manually reconciled and communicated to the broader team.
Furthermore, standard BIM platforms are not inherently designed to process and visualize abstract, multi-criteria algorithmic data natively. Stakeholders are forced to toggle between building geometry, external analytical software, and static reports, leading to communication breakdowns and misaligned project goals.
The industry urgently requires a system that stops treating data and geometry as separate entities.
Without a bridge to translate complex programmatic algorithms into tangible, intuitive visual feedback within the primary BIM environment, teams miss critical optimization opportunities, risking the overall sustainability, structural efficiency, and financial viability of the development.
The challenge was to invent a systematic approach that forces abstract data to manifest physically within the standard documentation and visualization tools already utilized by major architectural practices.

Bridging the Ecosystem Gap.
To resolve the divide between parametric data and BIM geometry, Archificials developed an advanced integrative modeling workflow centered entirely on the Rhino.Inside Revit ecosystem.
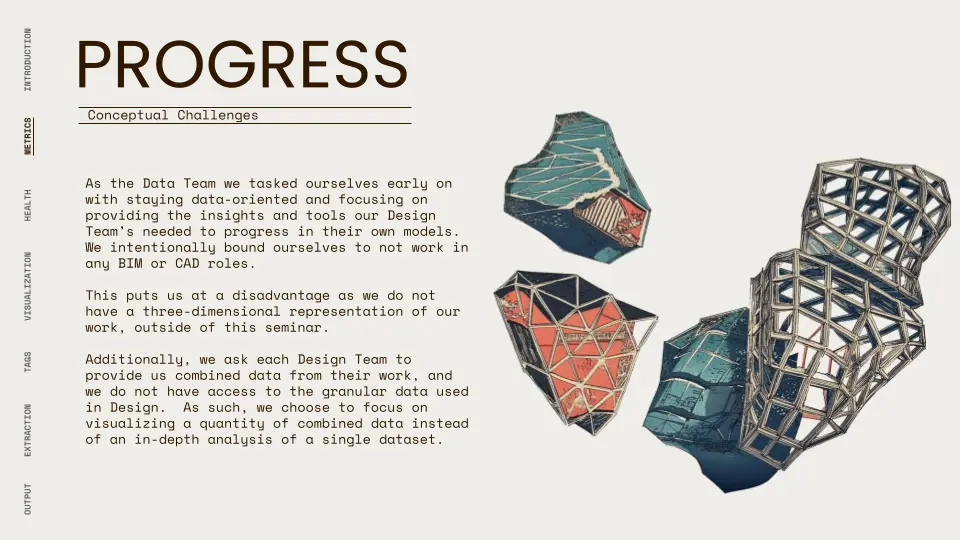
We intentionally avoided standard CAD roles, focusing instead on establishing a robust data pipeline capable of capturing cumulative component values from multiple design teams simultaneously.
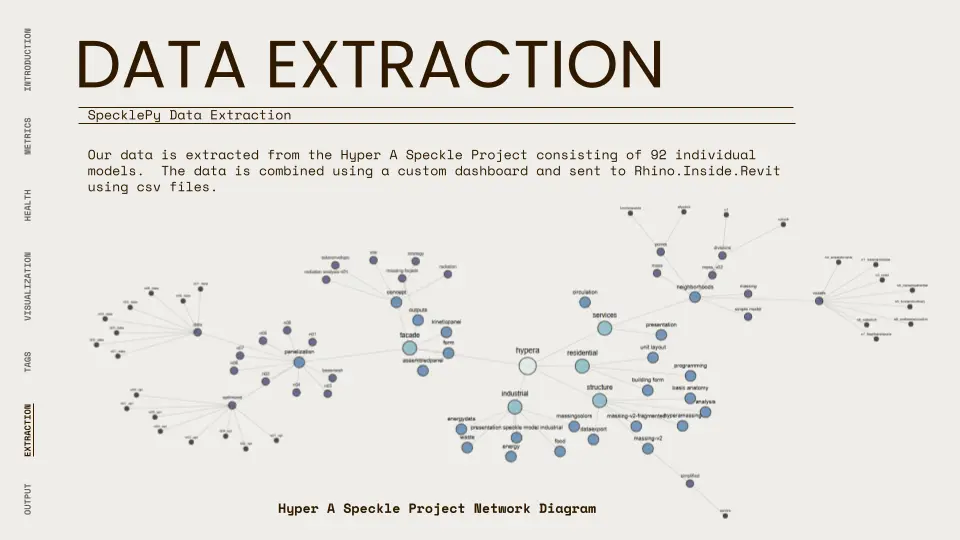
Our methodology began with data extraction via SpecklePy, pulling diverse metrics from over ninety individual models into a centralized dashboard. The critical breakthrough was developing a normalized comparison framework.
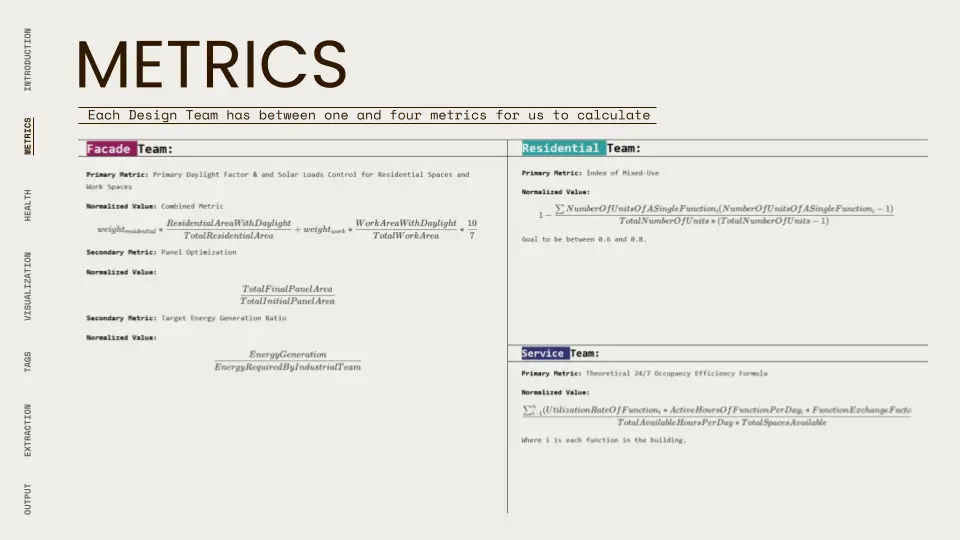
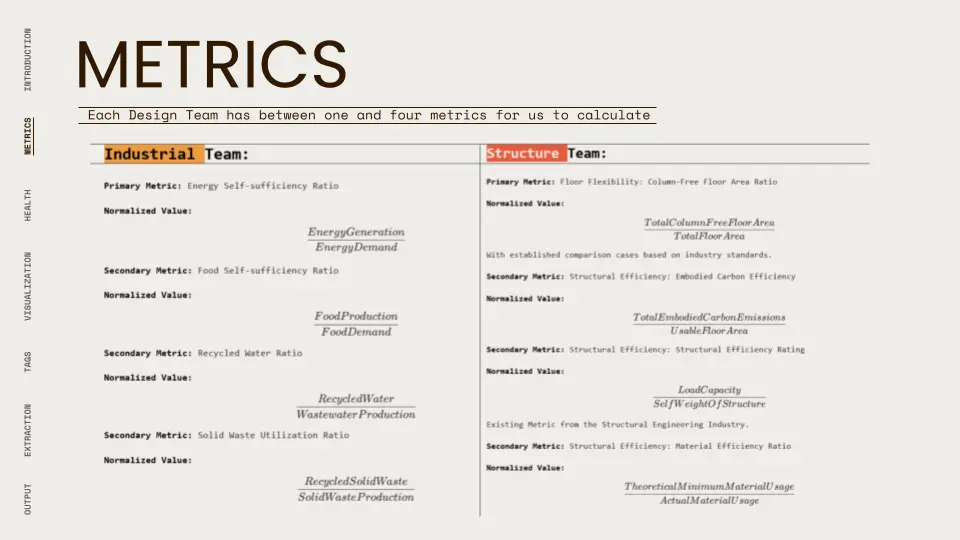
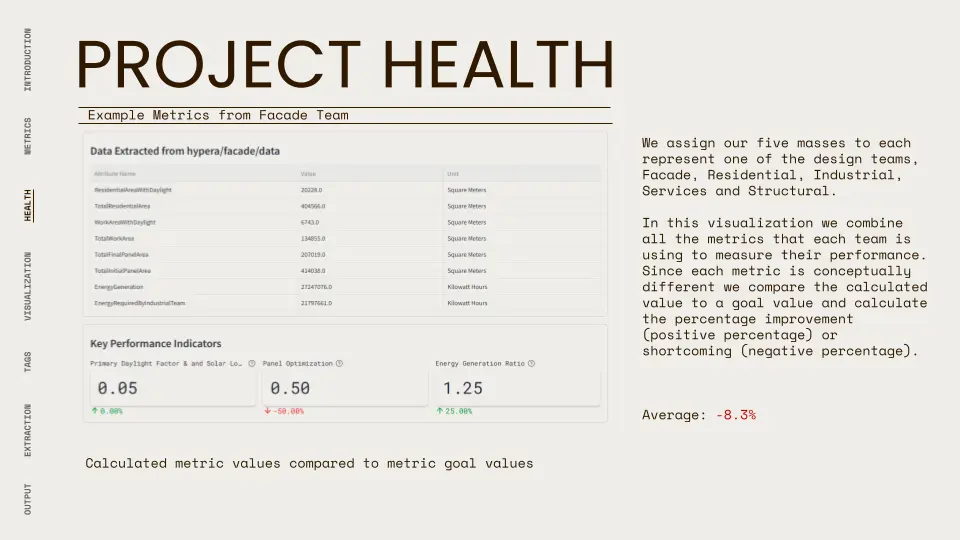
Because we were dealing with fundamentally different metrics (such as "Energy Self-sufficiency Ratio" versus "Column-Free Floor Area Ratio") we engineered a computational logic that evaluates each team's calculated metric against its specific target goal.
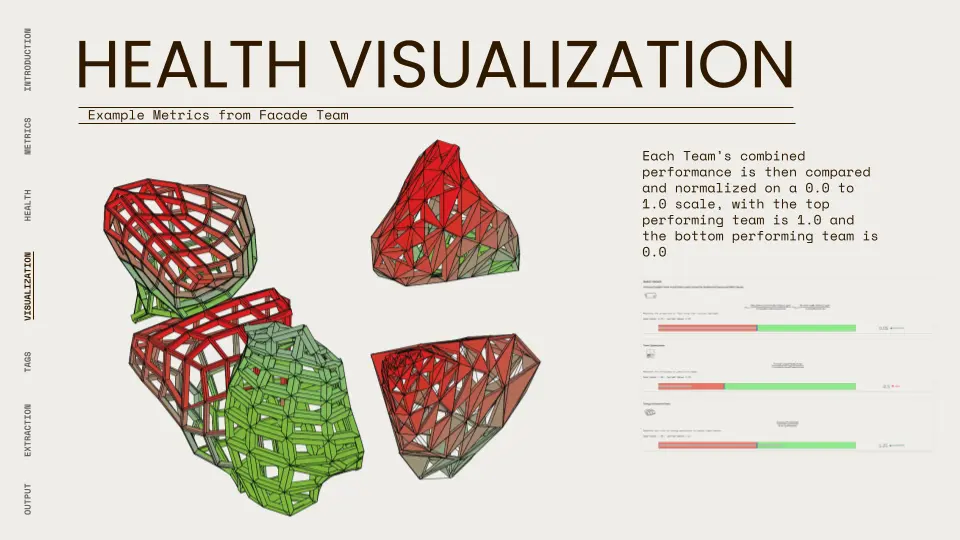
This process calculates the percentage of improvement or shortcoming and normalizes every diverse measurement onto a strict 0.0 to 1.0 mathematical scale.
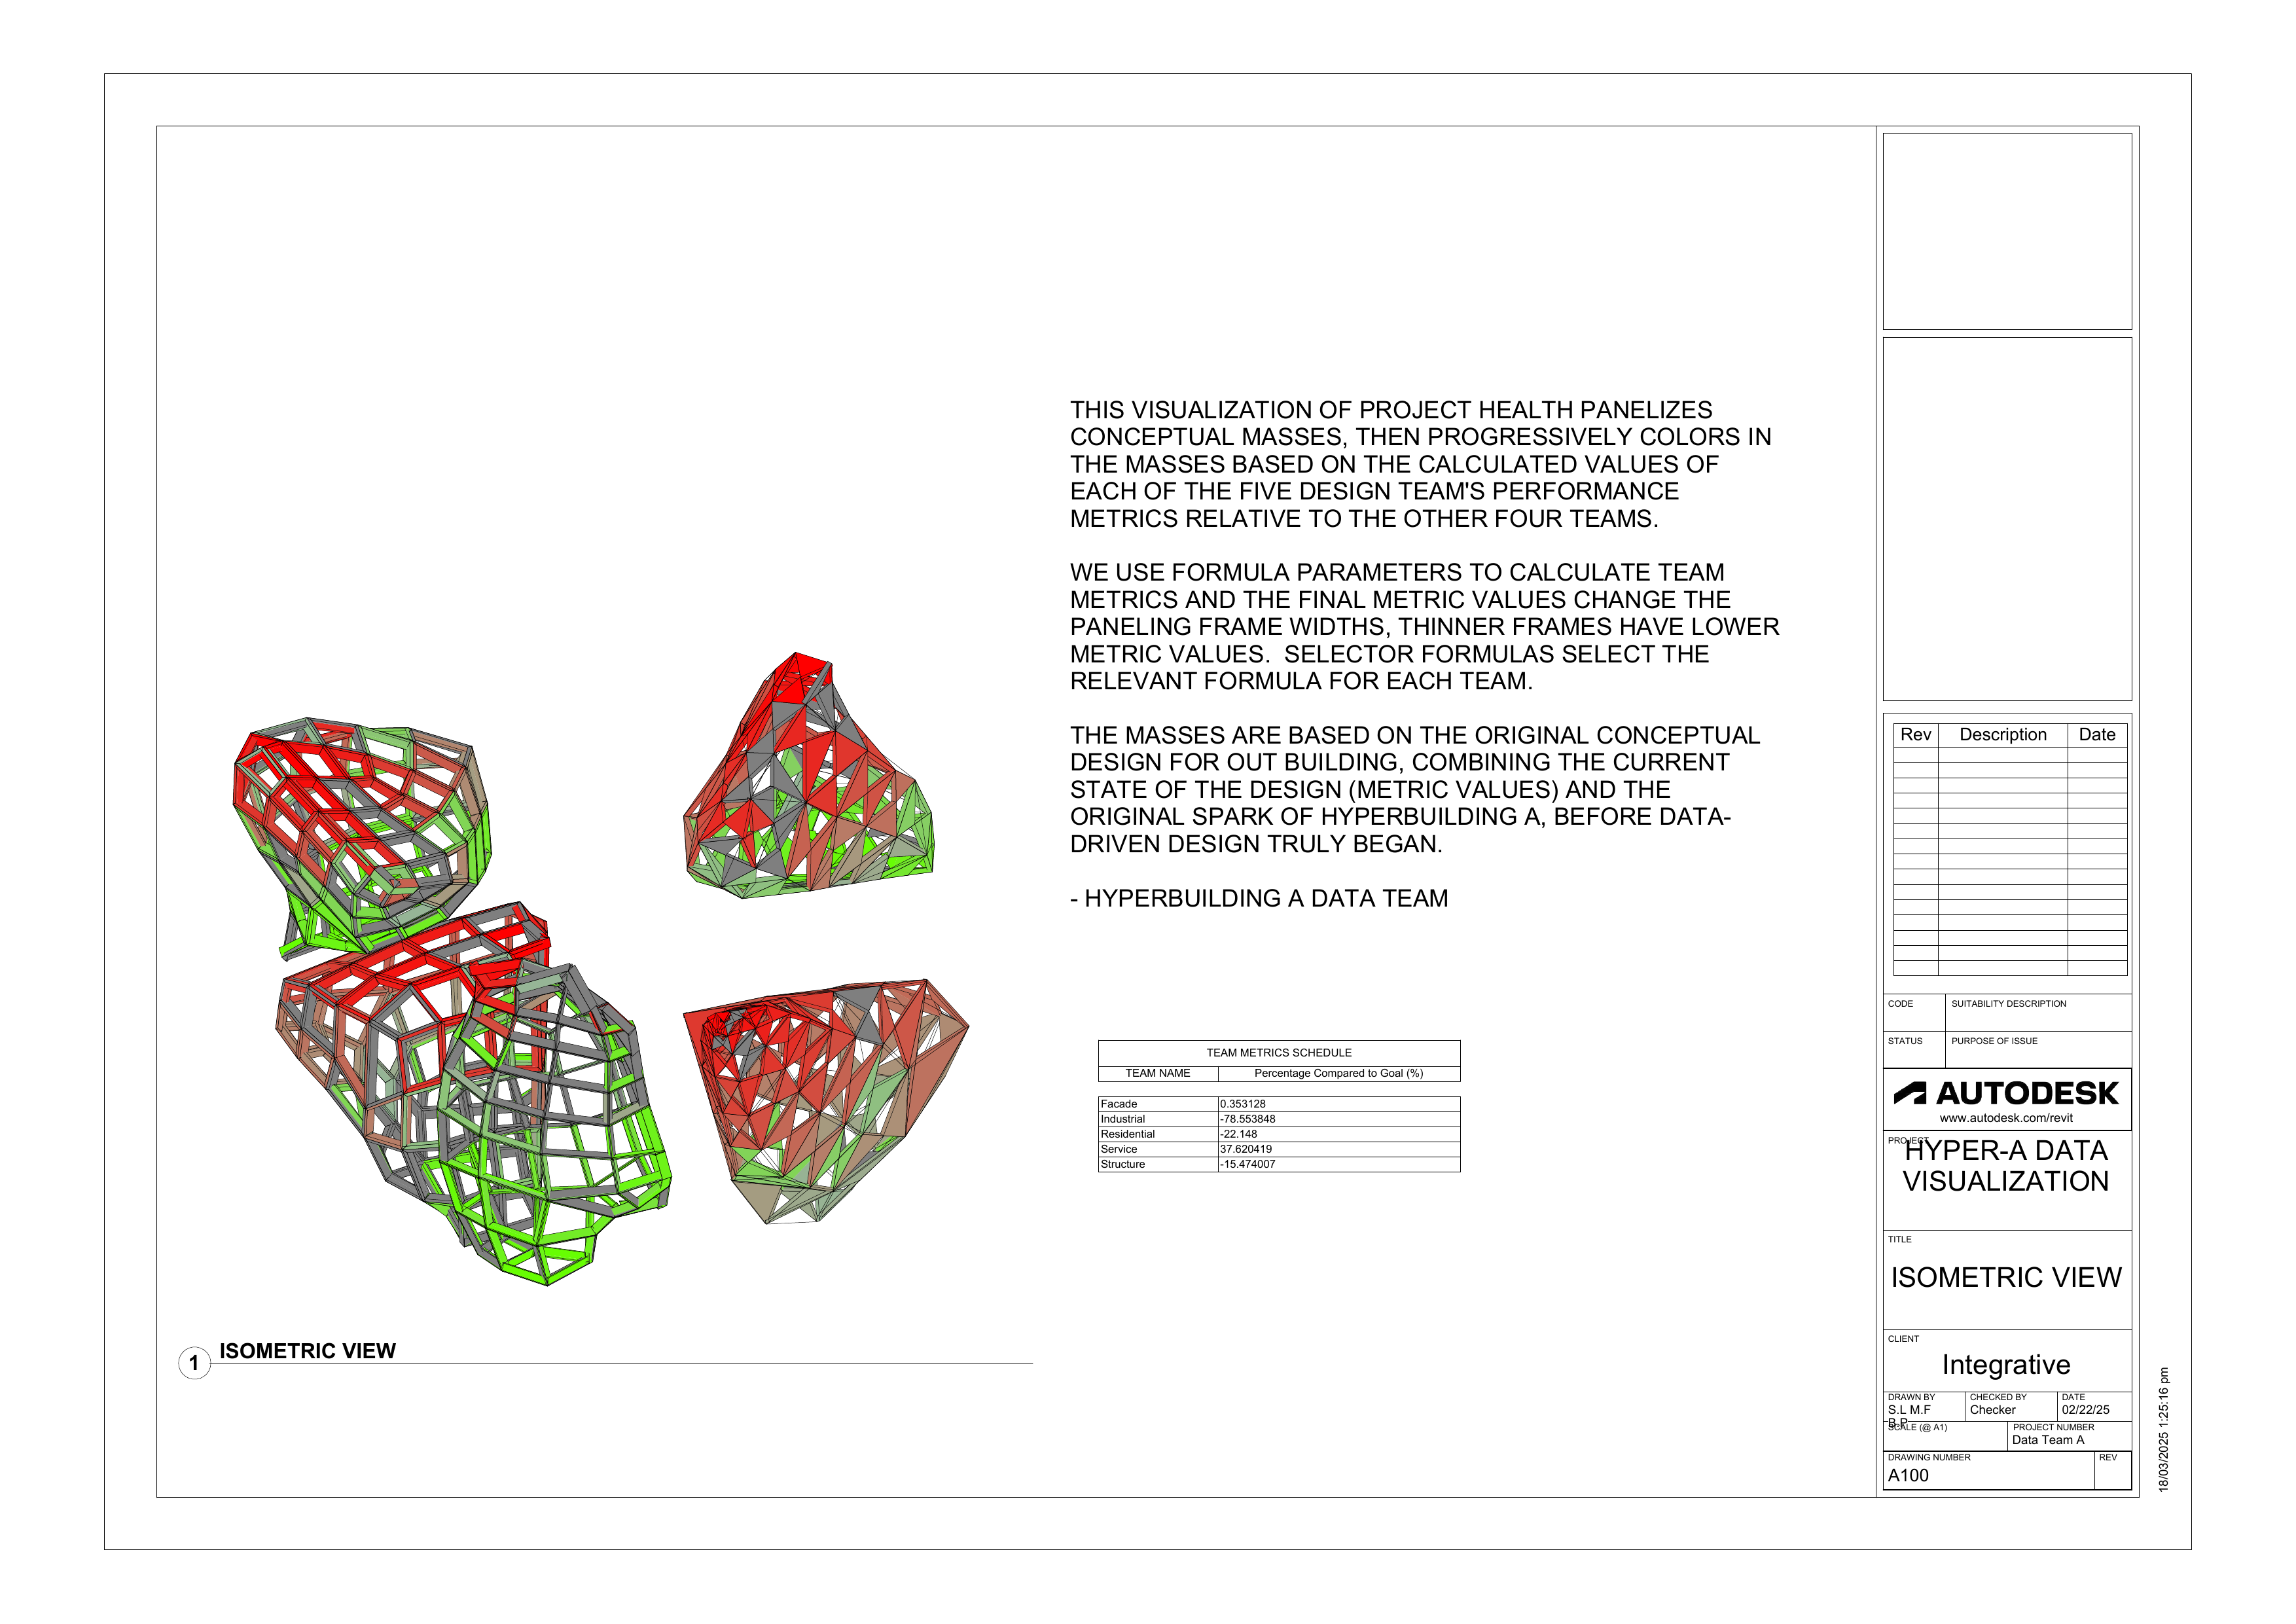
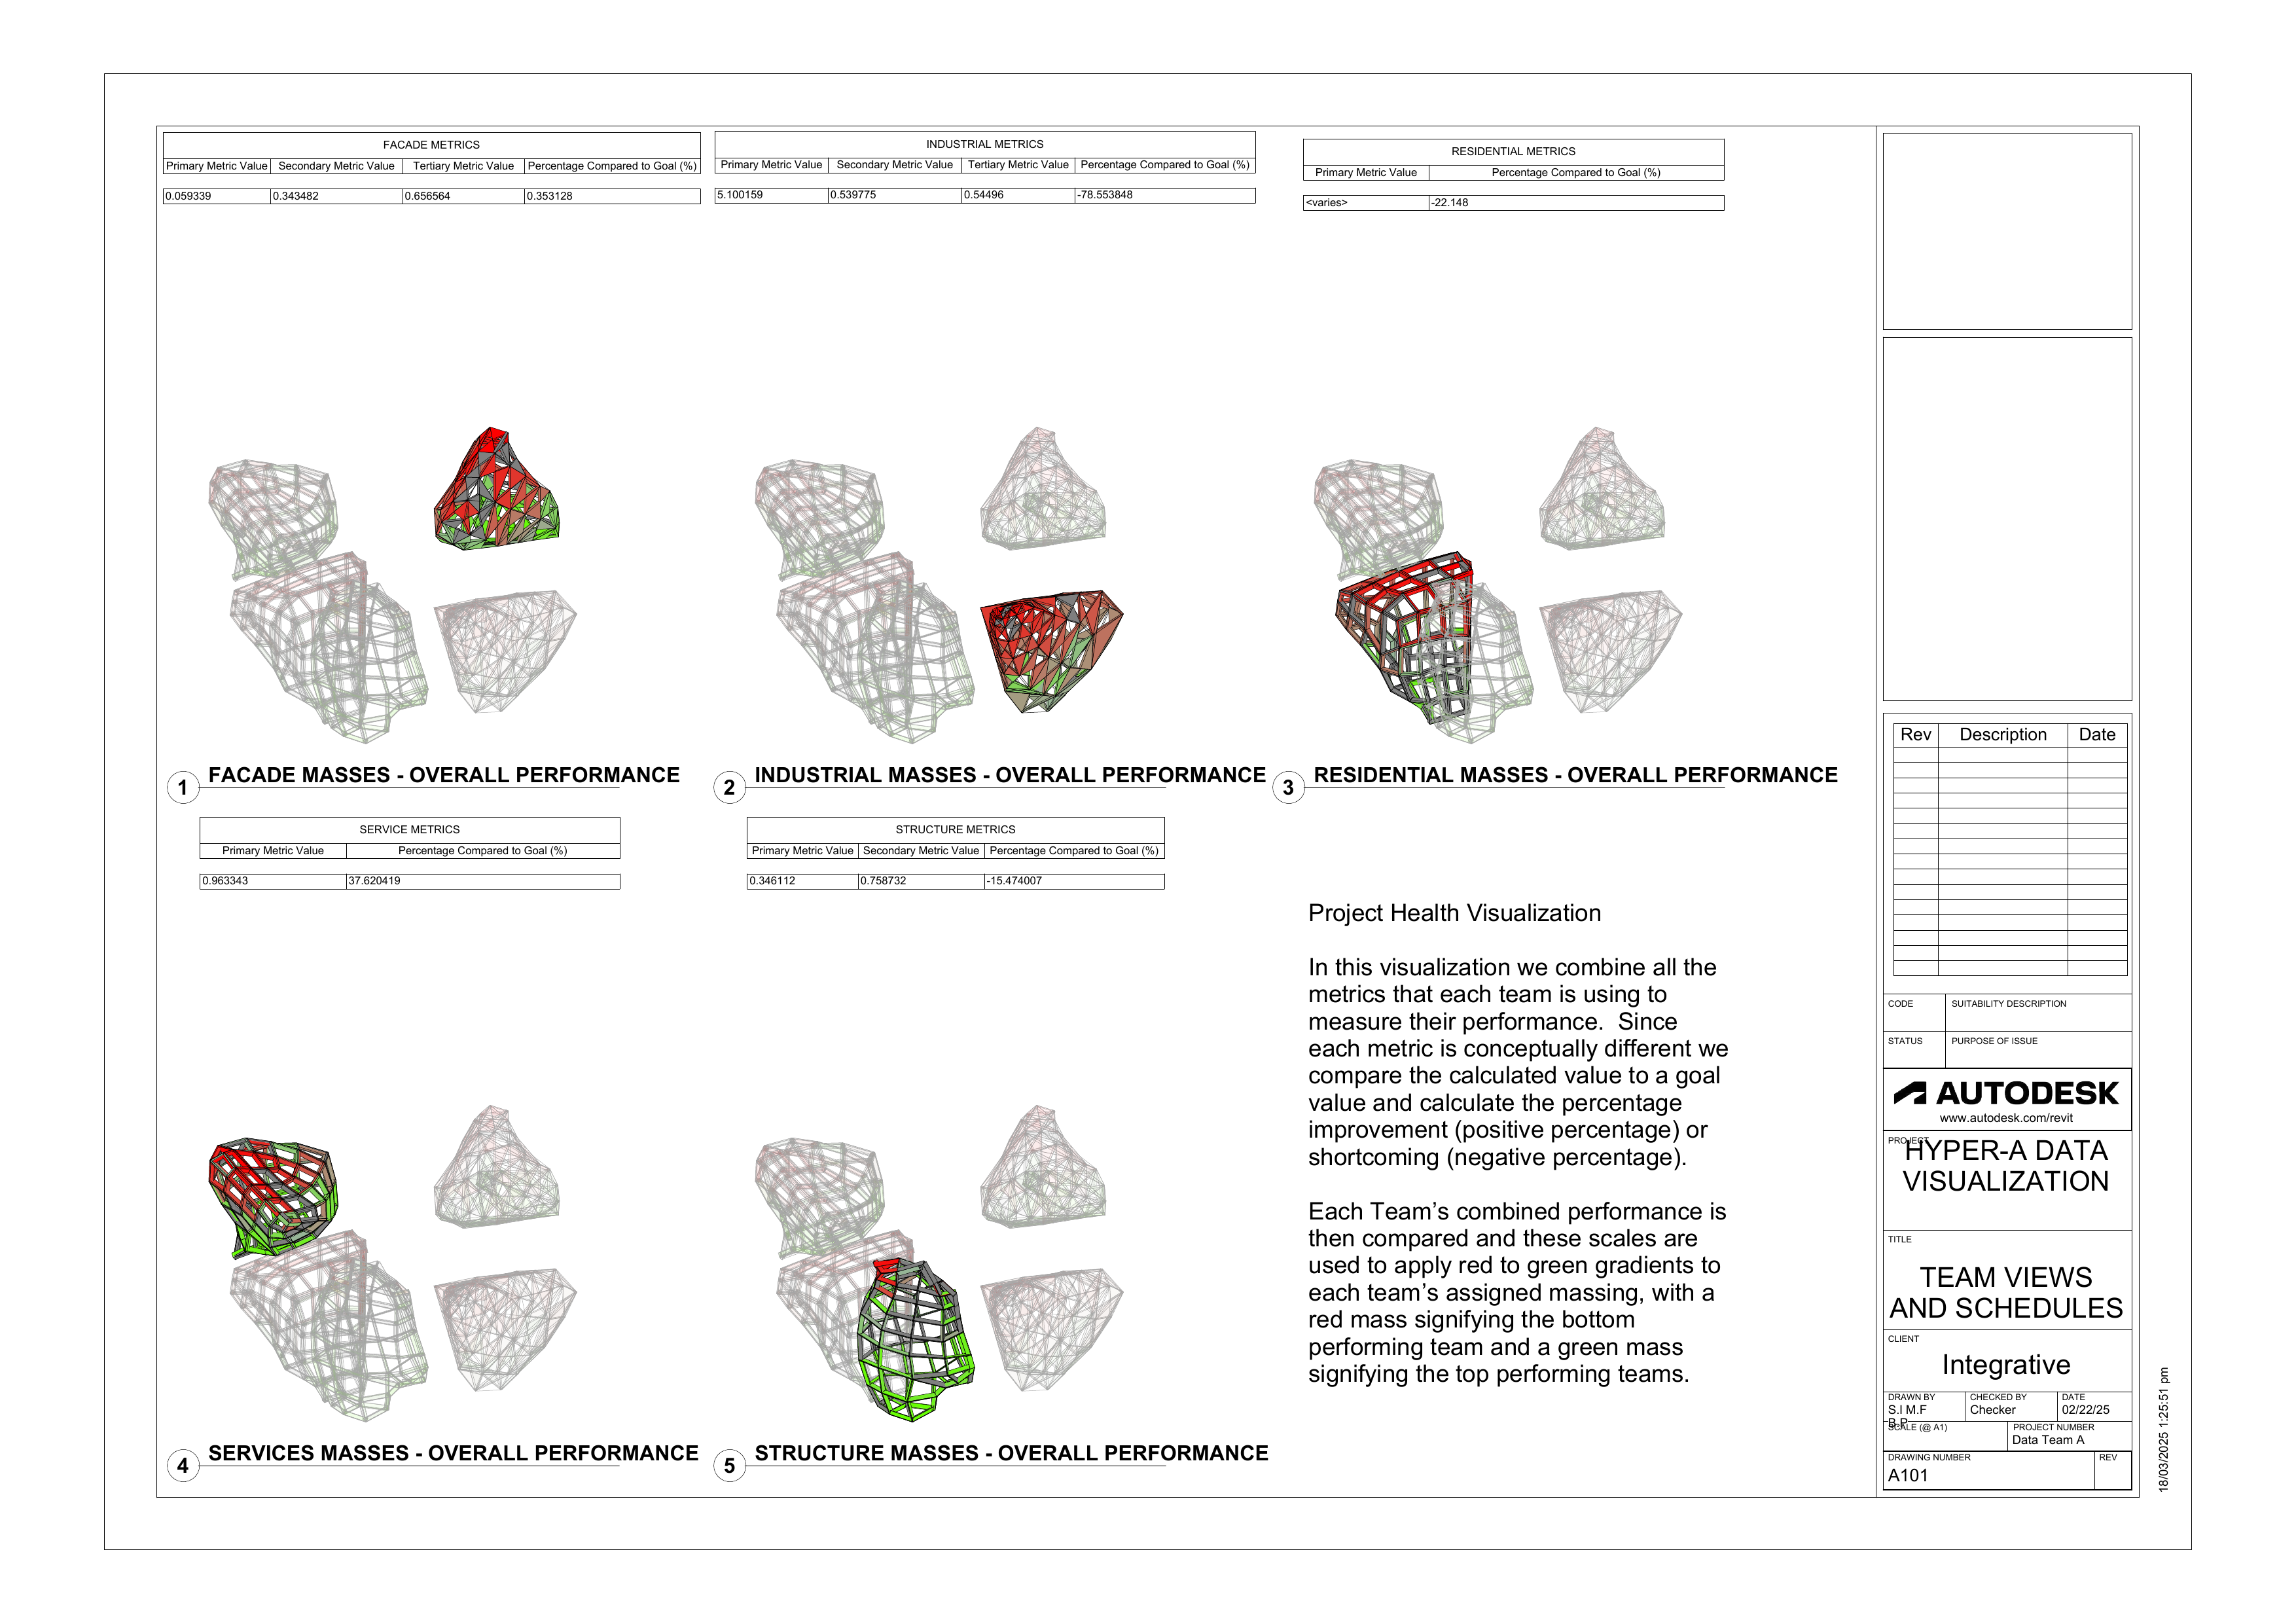
To represent this abstract data visually, we utilized five conceptual massing elements from the project's initial design phase to act as geometric proxies for the Facade, Residential, Industrial, Services, and Structural teams.
Using the Rhino.Inside Revit bridge, our Grasshopper definitions push the normalized data directly into these massing vessels. We then automated the application of visual feedback systems natively within Revit.
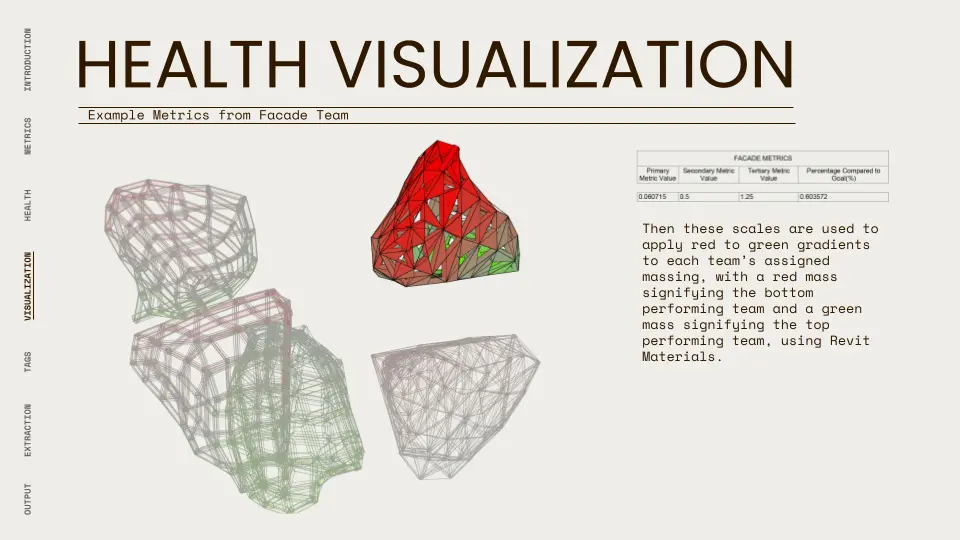
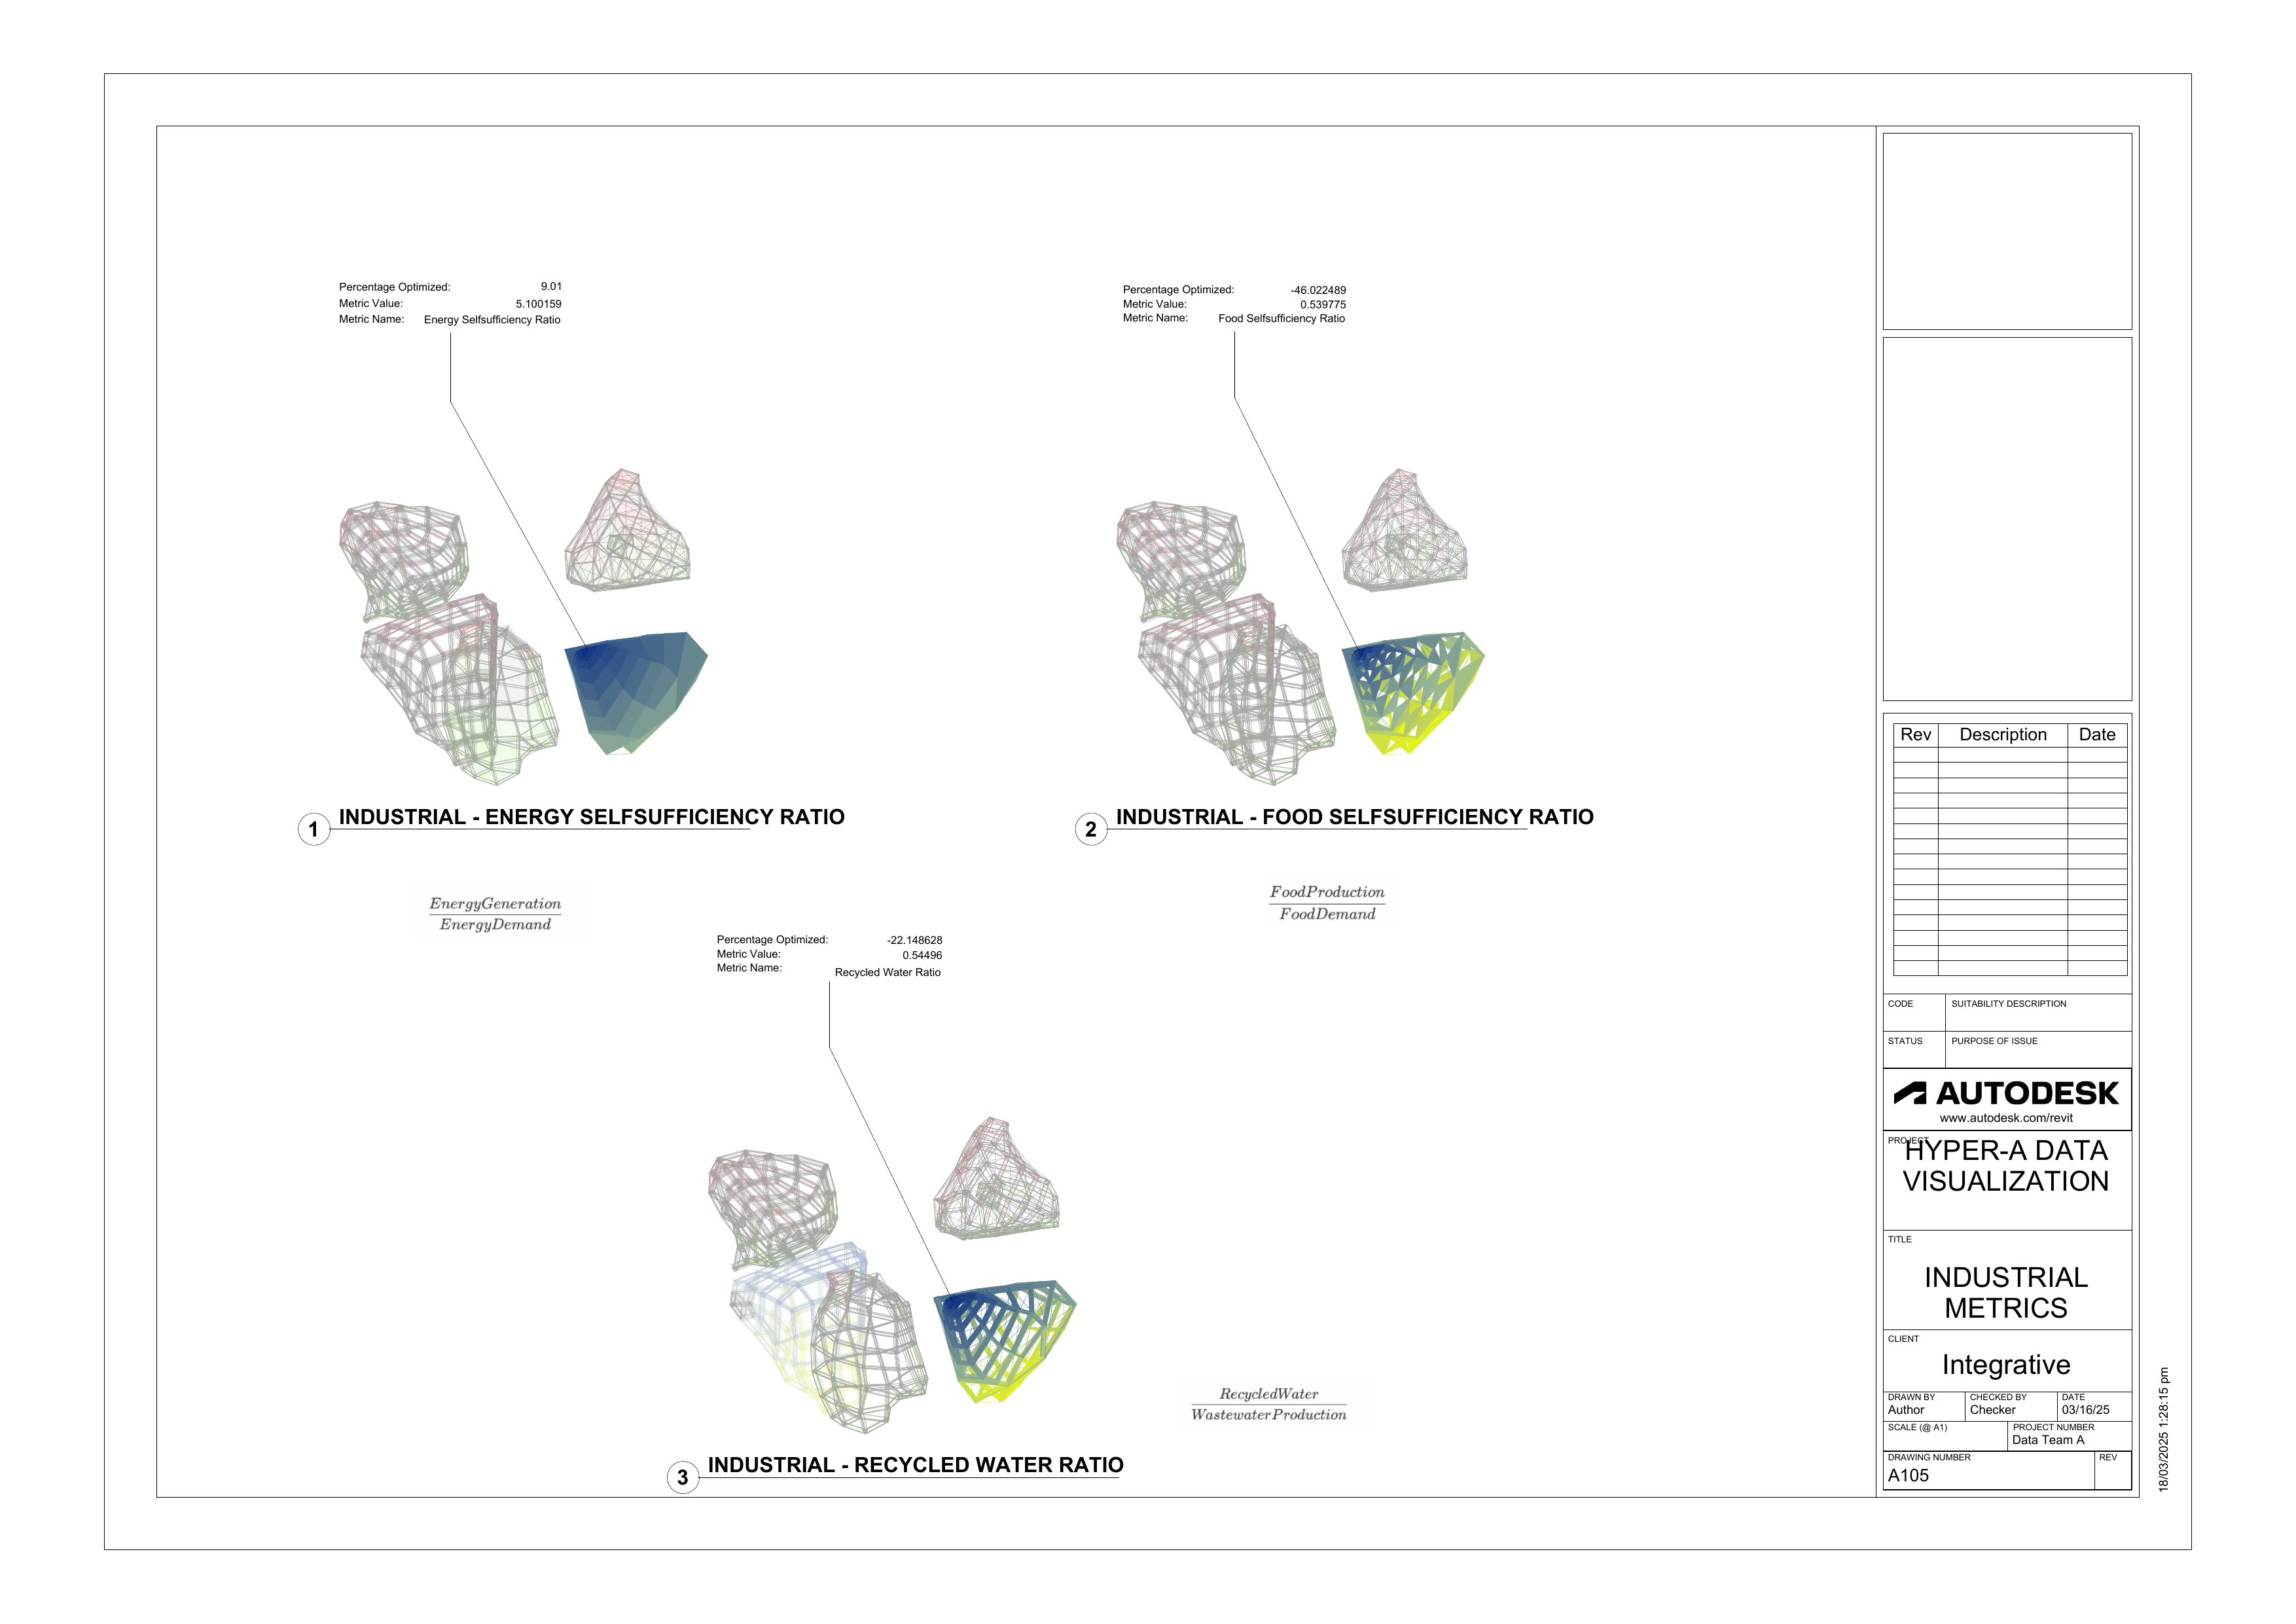
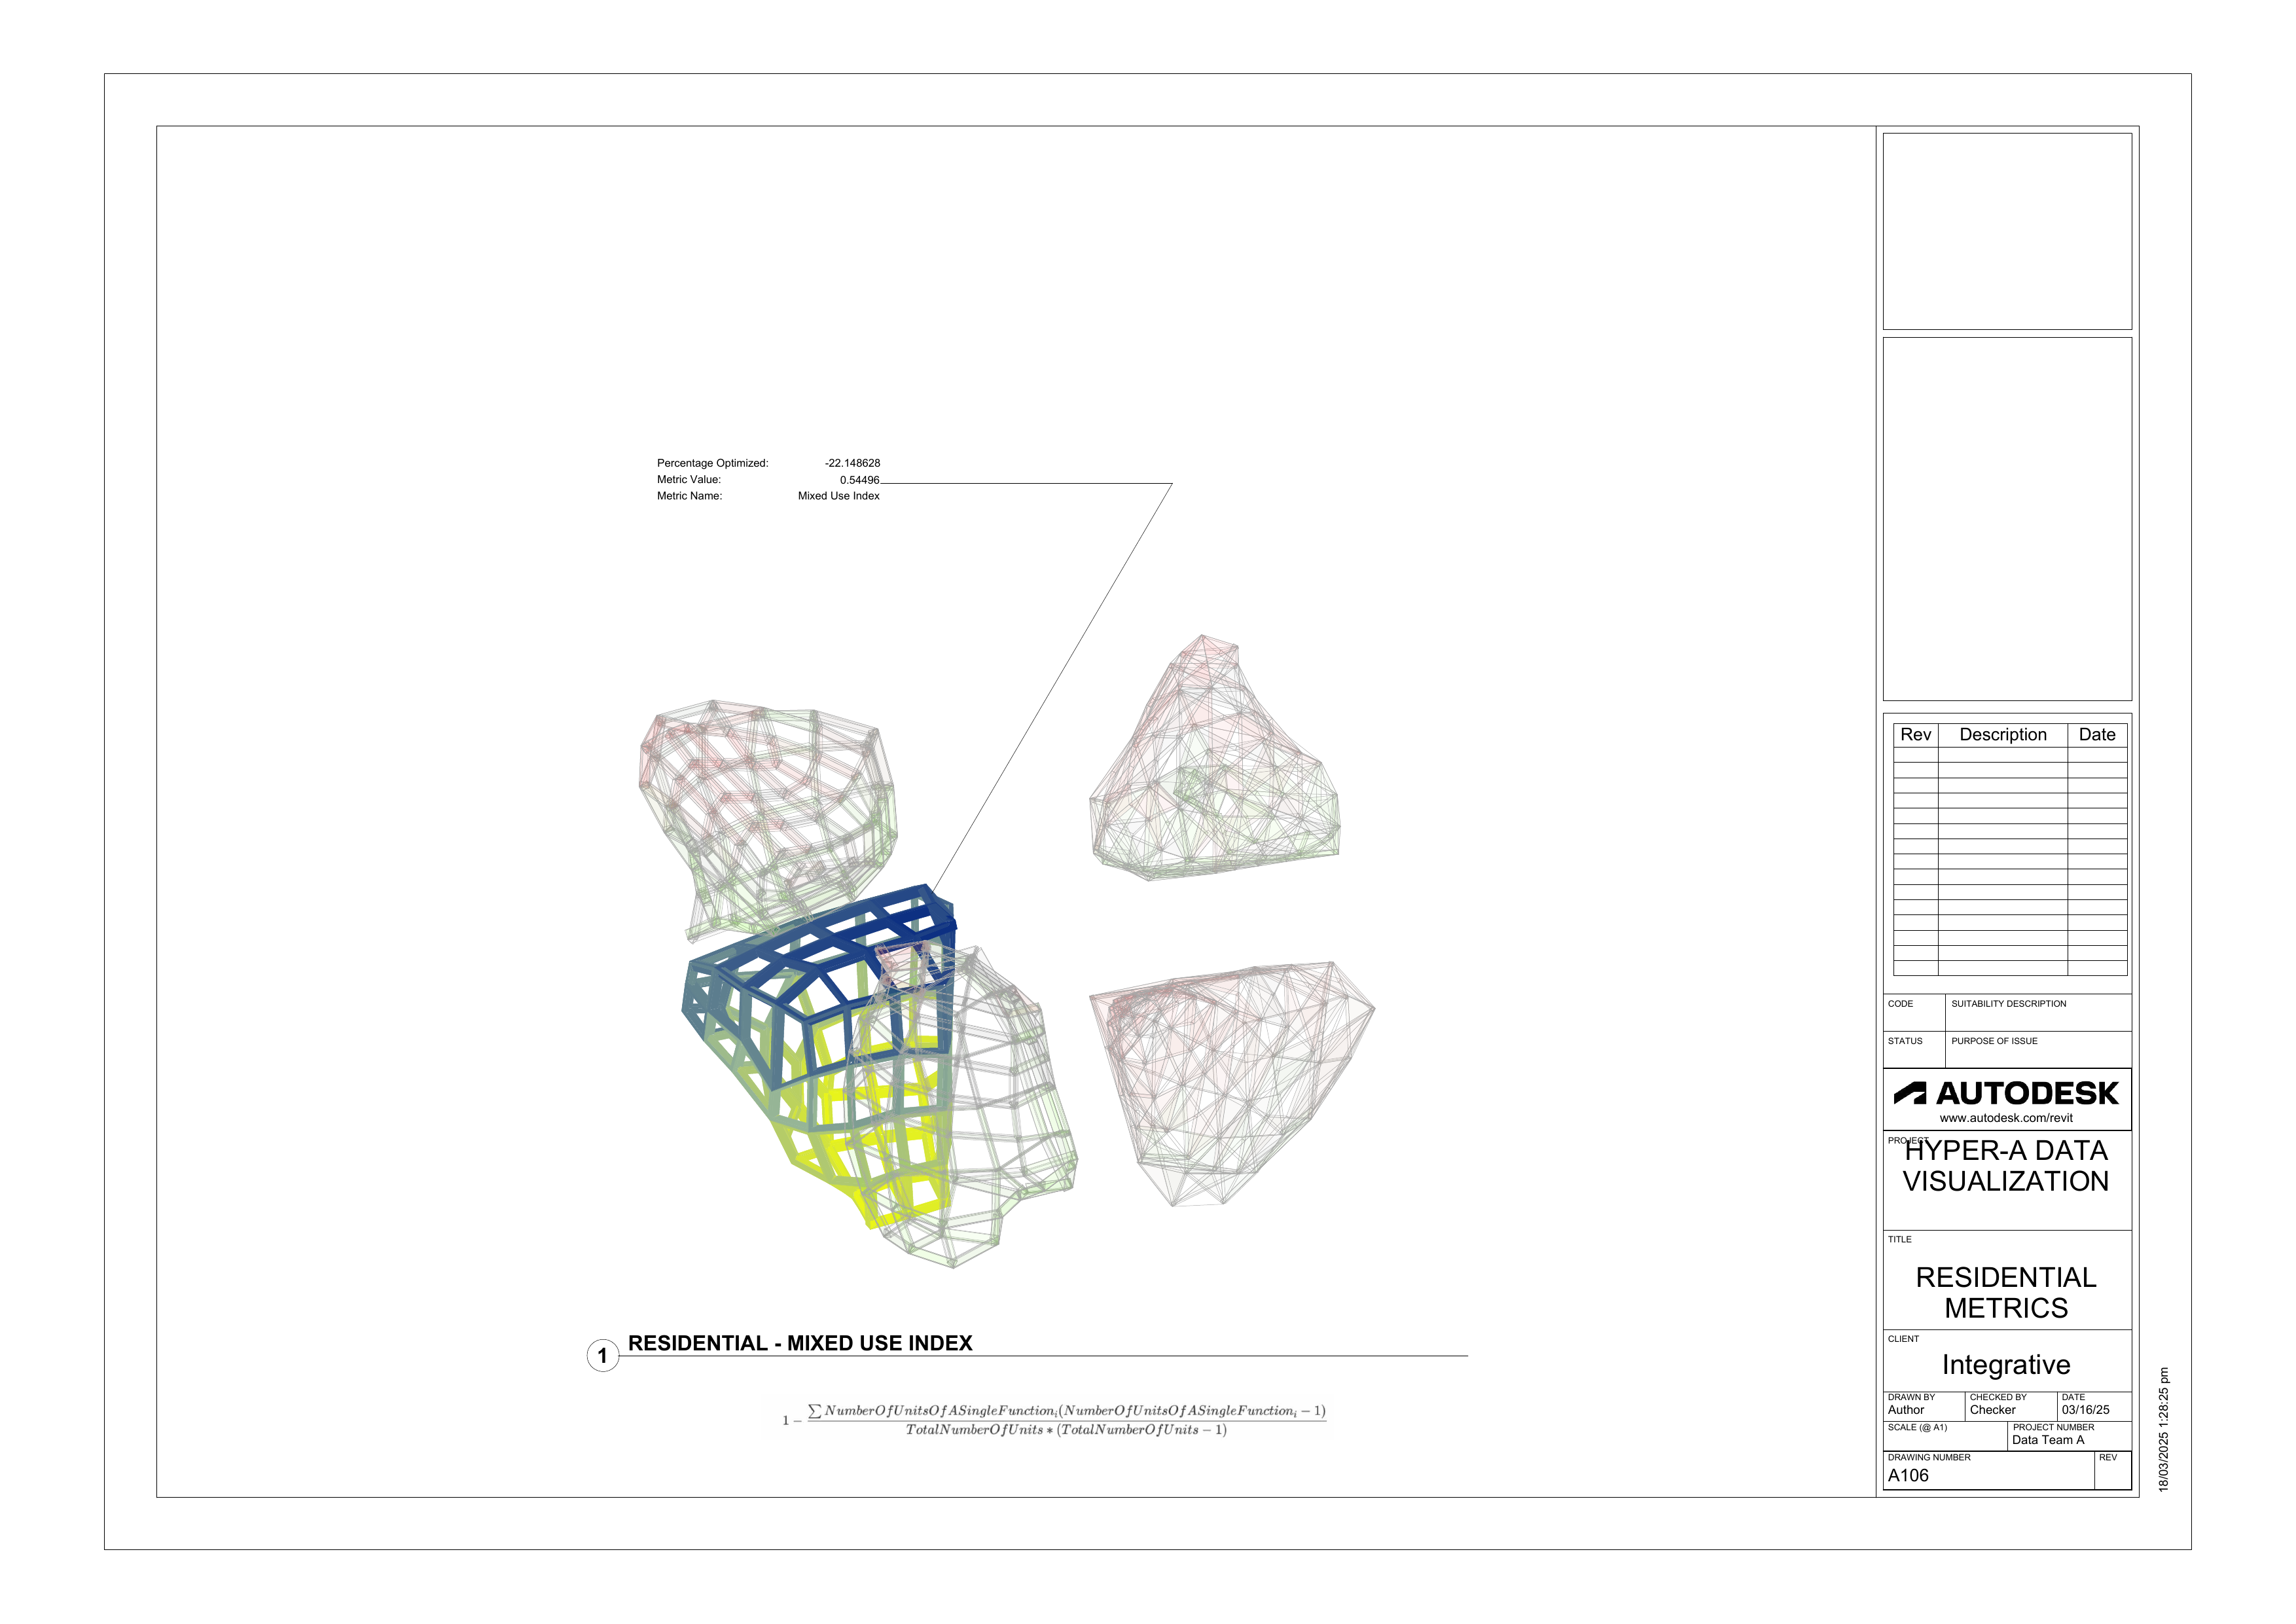
By scripting logic to control Revit's Material and Graphic Override systems, we created dynamic color mapping. We implemented a red-to-green material gradient across the team masses to instantly indicate relative performance rankings, green denoting top optimization and red highlighting underperformance.
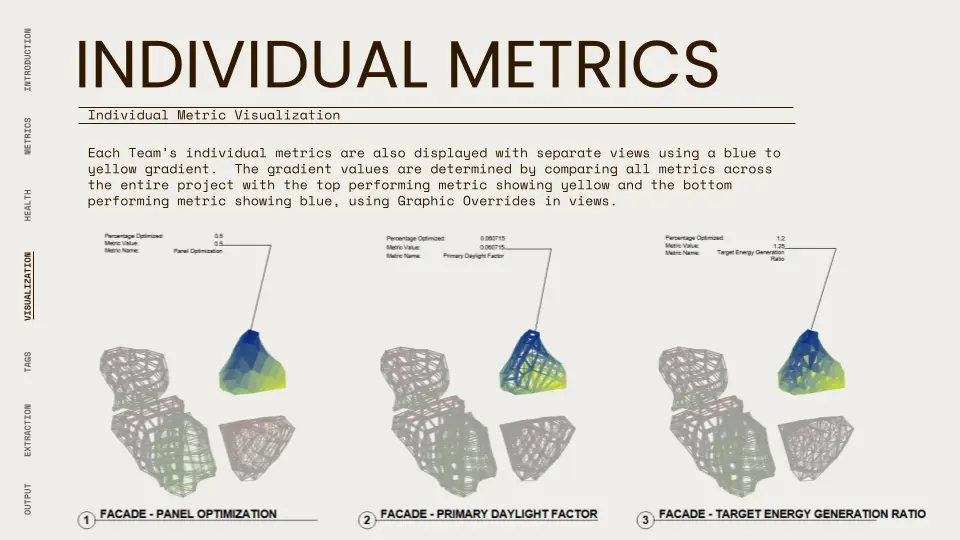
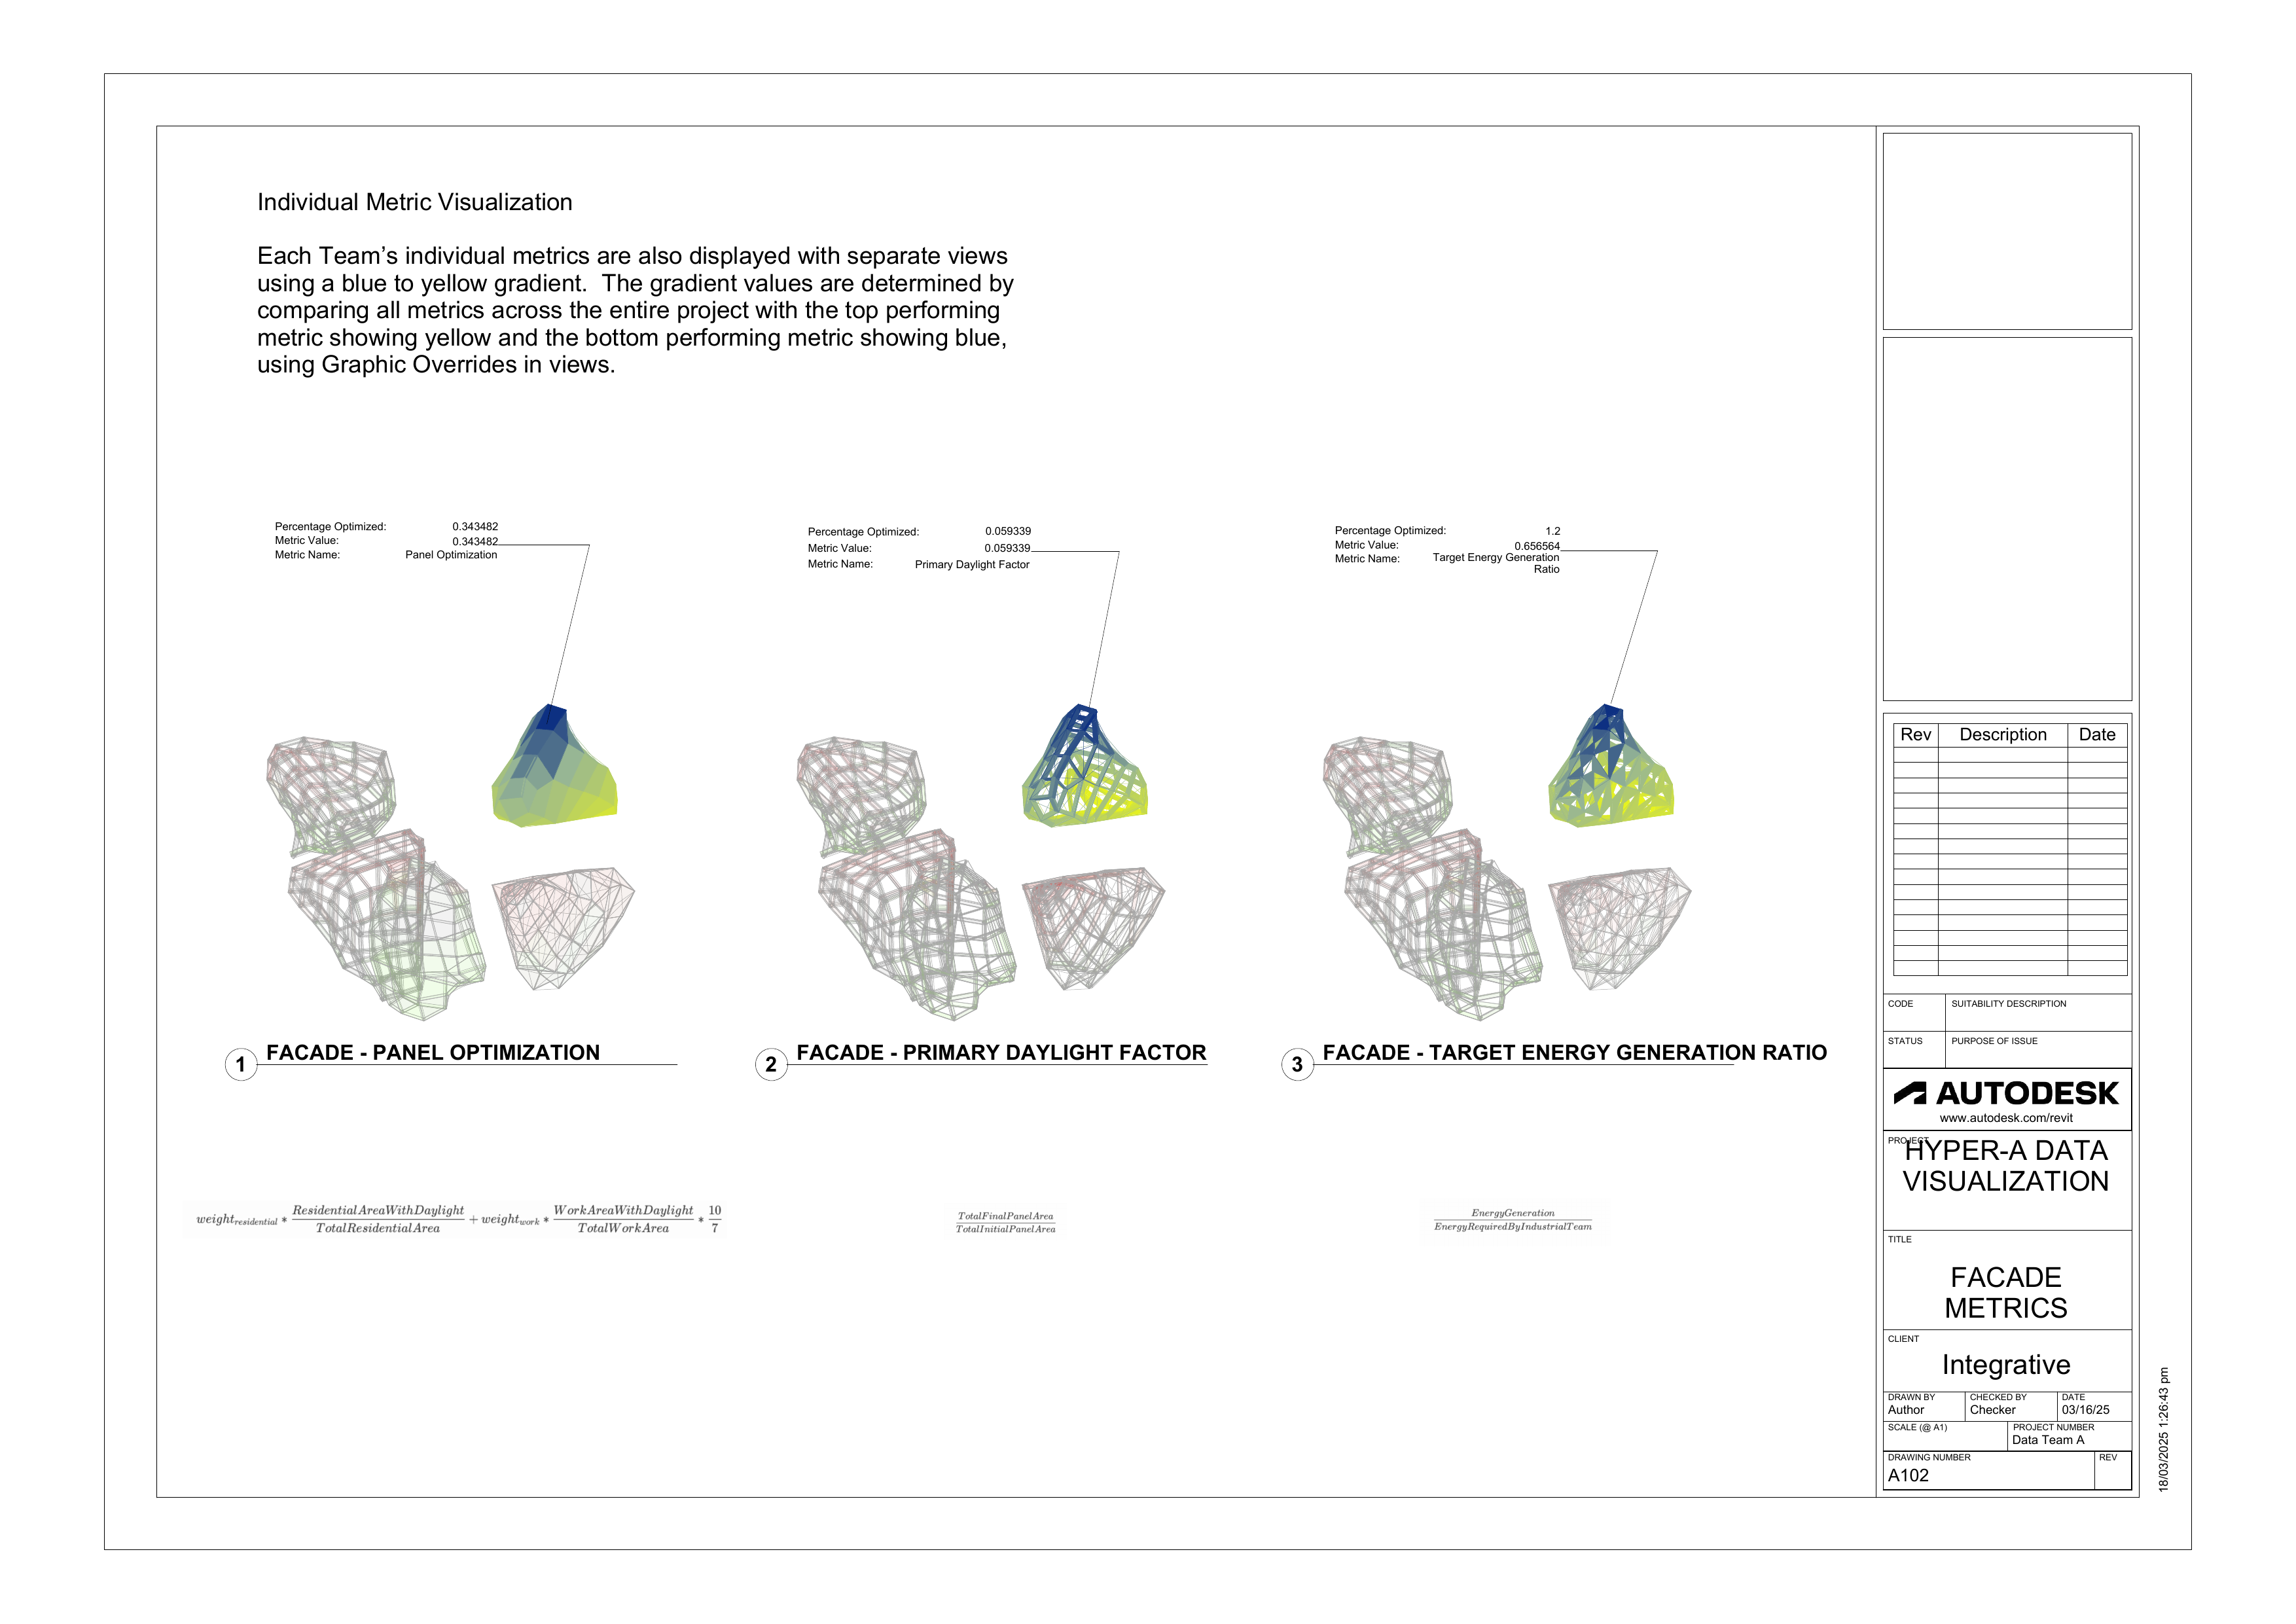
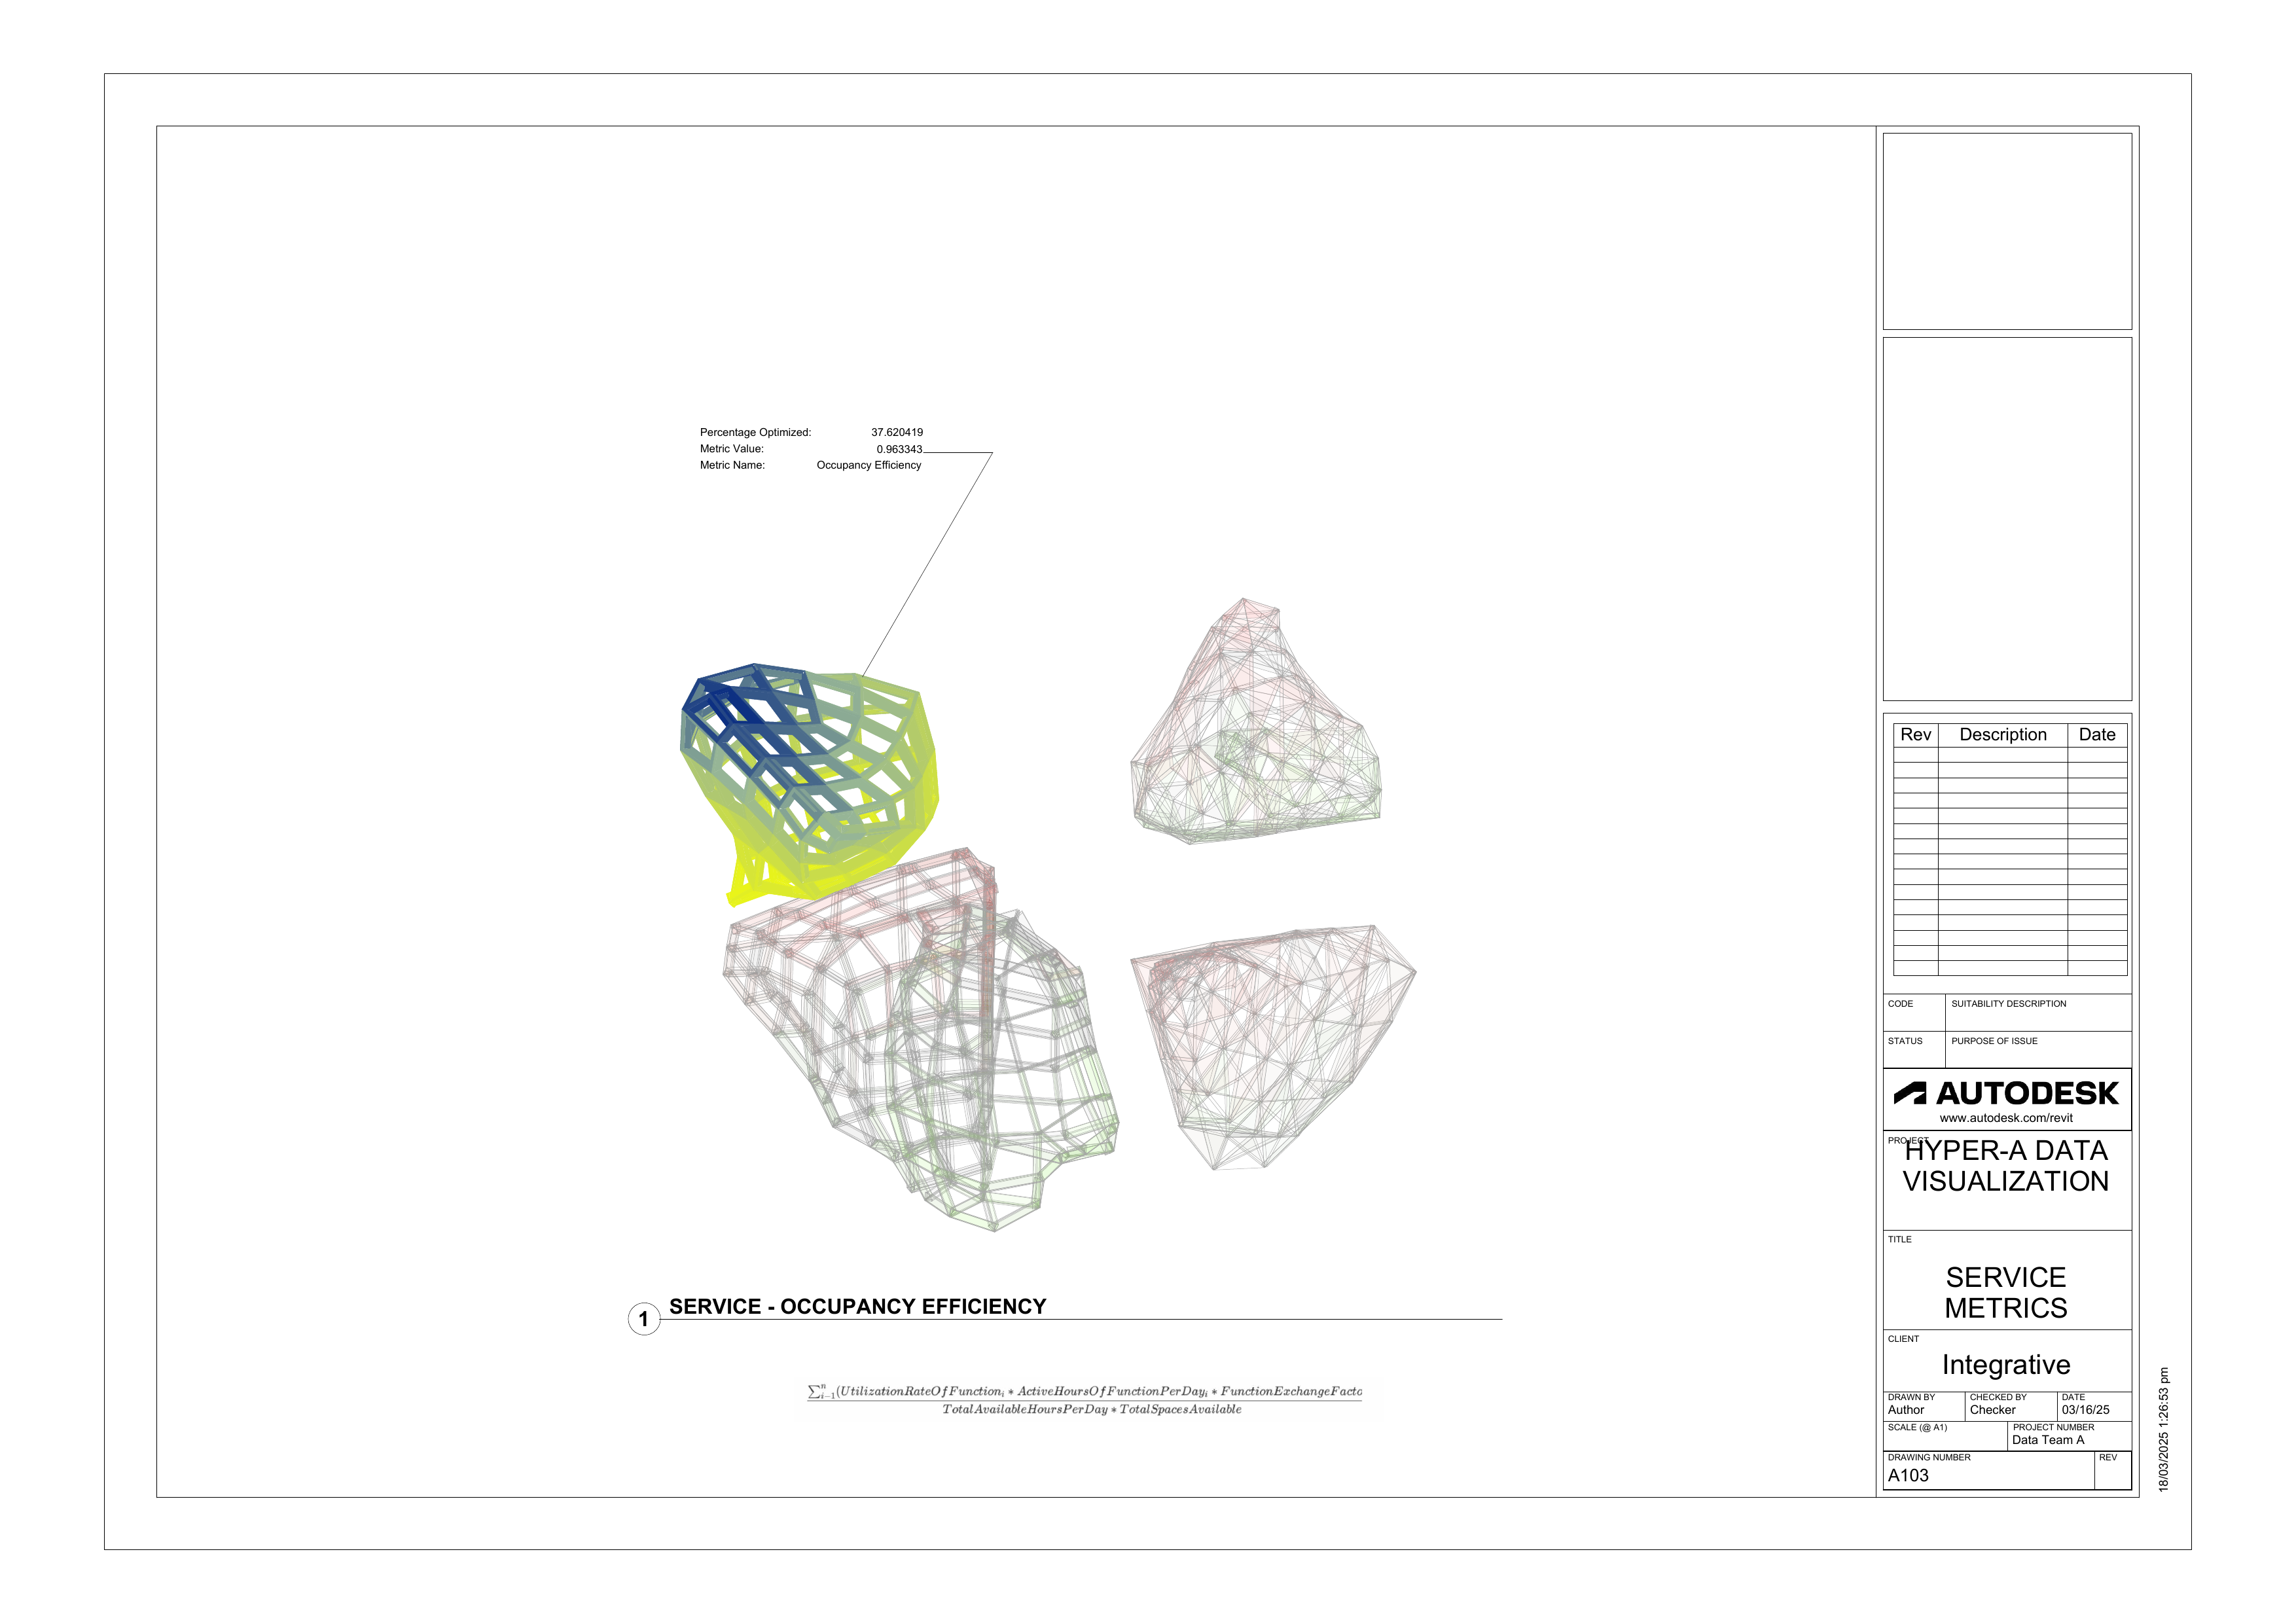
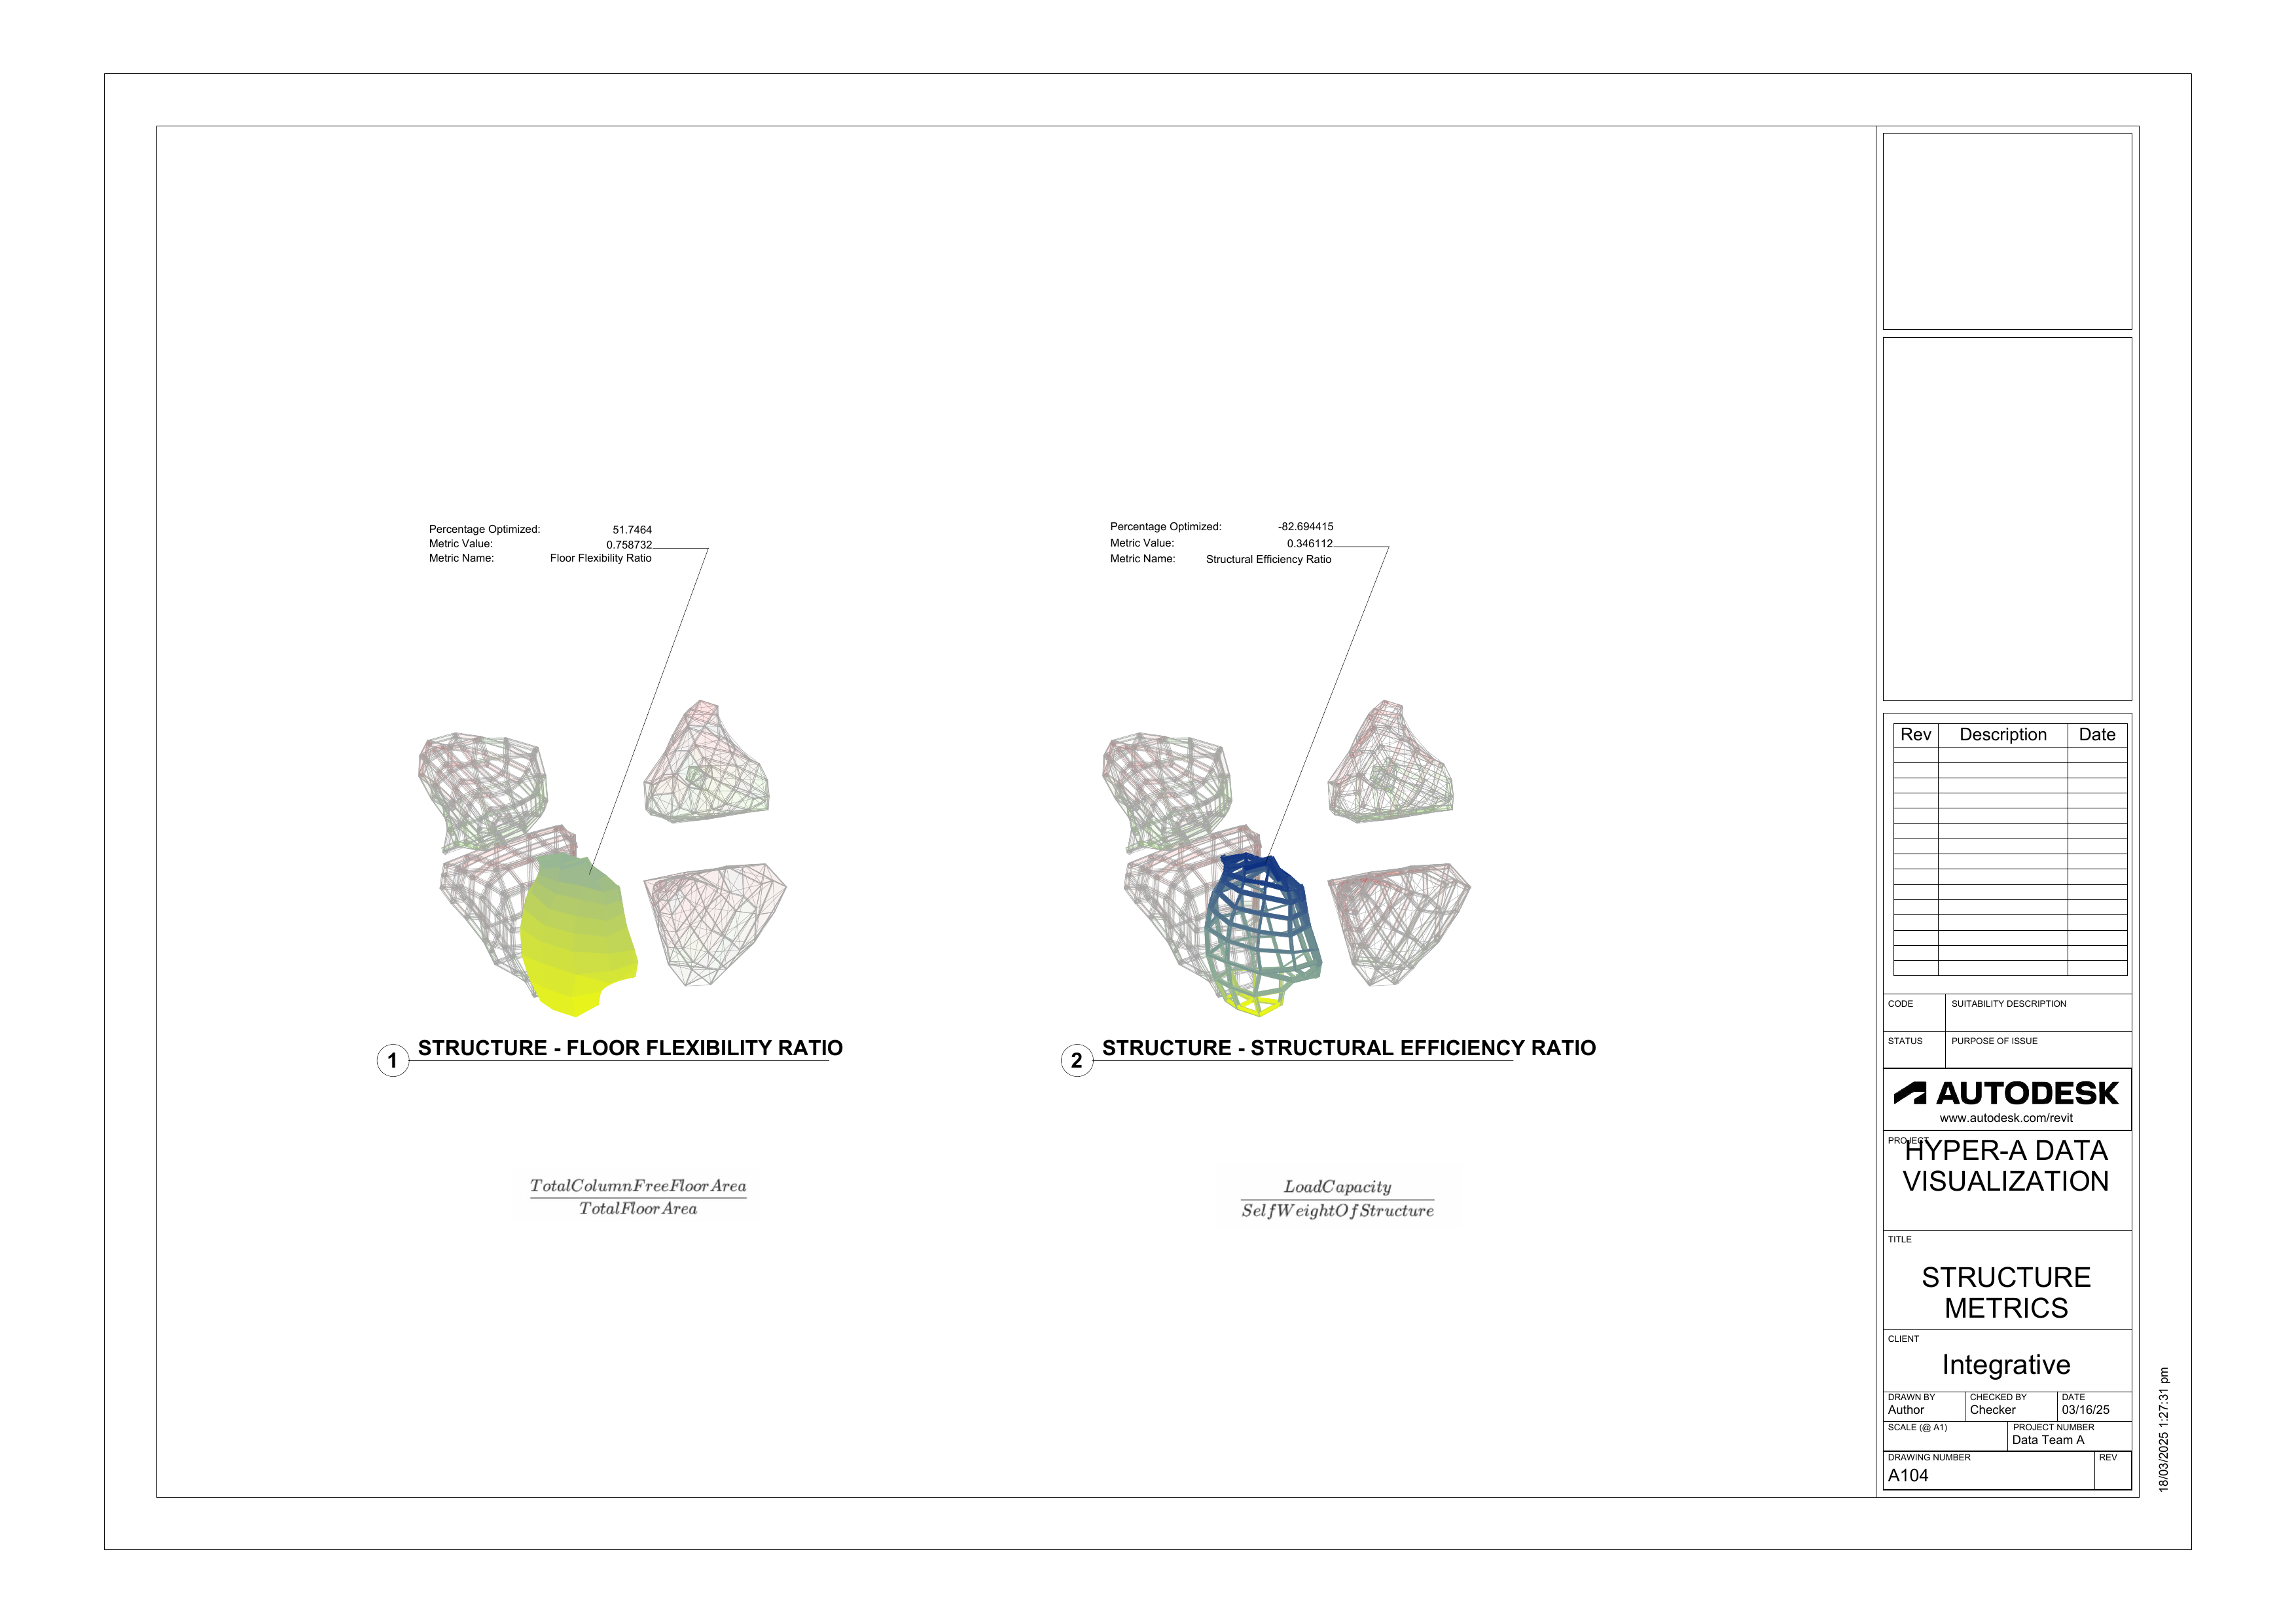
Simultaneously, we applied a blue-to-yellow graphic override to visualize individual secondary and tertiary metrics across specific project views.
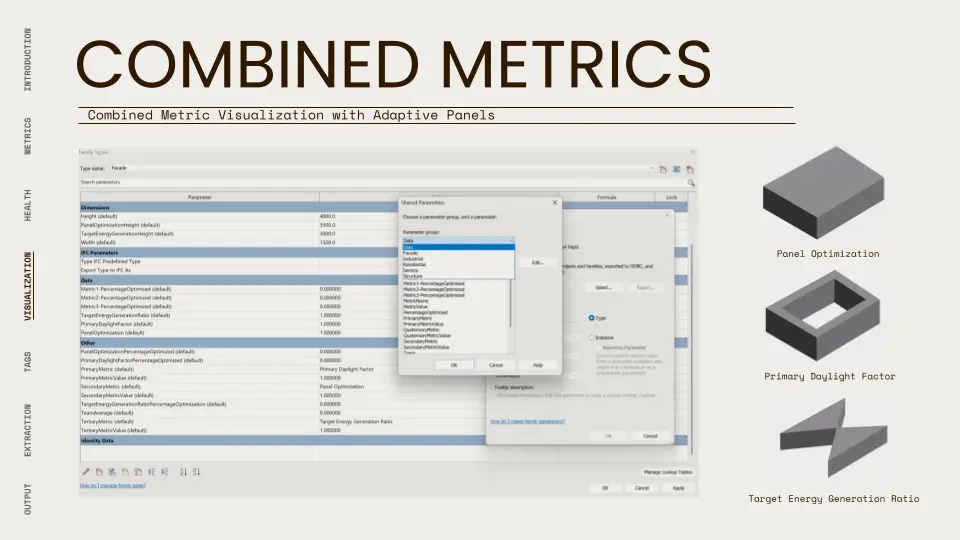
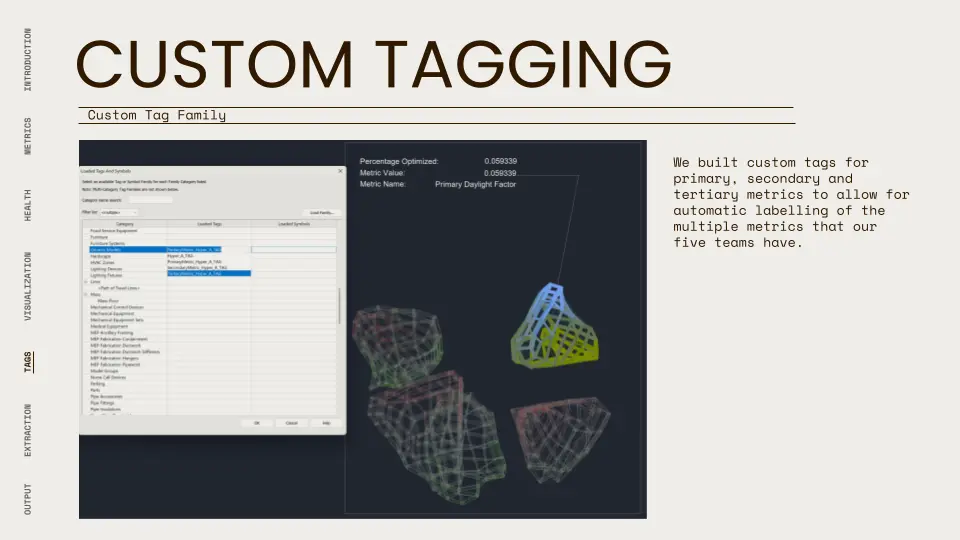
Finally, we developed custom Revit Tag Families that automatically read and label these complex shared parameters. This comprehensive approach ensures that algorithmic data is not just calculated, but intrinsically woven into the visual and documentary fabric of the BIM model.
An Automated Data to Model Pipeline
This integrative tool acts as a sophisticated data-to-BIM pipeline that seamlessly connects Grasshopper’s computational power with Revit’s robust documentation capabilities. It continuously processes diverse performance metrics from multiple teams, normalizes them mathematically, and injects the resulting data directly into native 3D geometry. This architecture actively drives automated visual feedback systems and dynamic custom tagging, delivering real-time architectural intelligence directly to stakeholders.

Automated Data Extraction:
A robust data pipeline utilizing SpecklePy to aggregate complex performance metrics from dozens of fragmented models, converting raw inputs into structured CSV data ready for advanced algorithmic processing.

Metric Normalization Engine:
A custom mathematical framework that processes entirely different metric types and units, comparing them against target goals to generate a unified 0.0 to 1.0 performance scale for direct and equitable comparison across disciplines.

Geometric Proxy Mapping:
The system assigns abstract normalized data to conceptual 3D massing elements within the model, utilizing these physical forms as interactive vessels for displaying otherwise invisible performance information directly in the viewport.
Gradient Visualization System:
Advanced scripting automates native Revit Material and Graphic Overrides, deploying red-to-green and blue-to-yellow color gradients on geometry to provide instant, intuitive visual feedback regarding overall project health and specific metric optimization levels for every discipline involved.
Intelligent Documentation & Tagging:
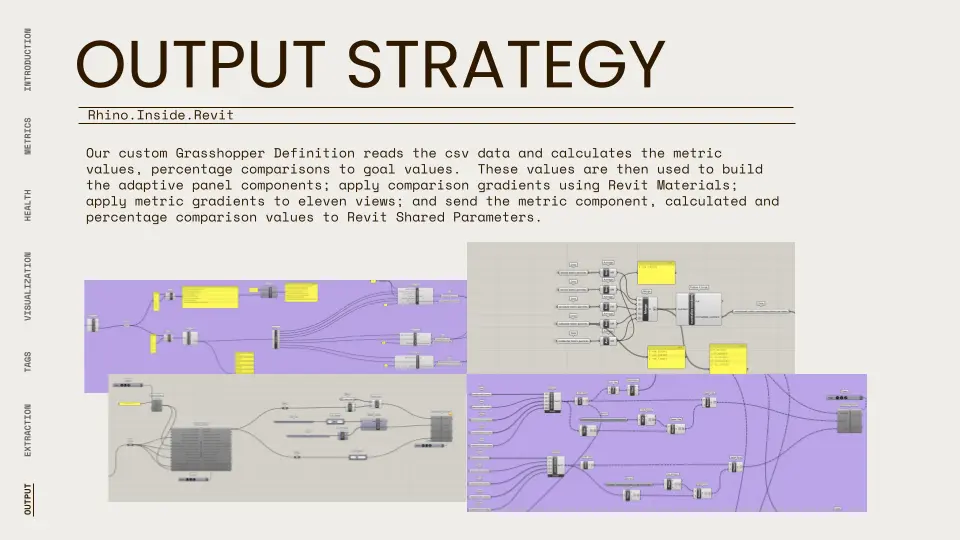
The Grasshopper definition pushes calculated metrics directly into Revit Shared Parameters. Custom tag families automatically read these parameters to seamlessly label 3D views and populate project schedules with highly accurate, up-to-date performance intelligence without requiring any manual data entry from the architectural teams. This ensures complete data integrity across all deliverables.
Orchestration:
The overarching architecture of this integrative solution represents a paradigm shift in how computational design interacts with production-level BIM.
By utilizing Rhino.Inside Revit as a foundational bridge, the system eliminates the traditional friction between abstract algorithmic testing and rigid construction documentation.
The backend logic relies on a highly efficient Grasshopper script that intercepts raw CSV data, executes complex normalization mathematics, and seamlessly drives the Revit API.
This means that when a structural engineer updates their embodied carbon calculations, the central Revit model instantly shifts its color gradients and updates its custom tags without manual intervention.
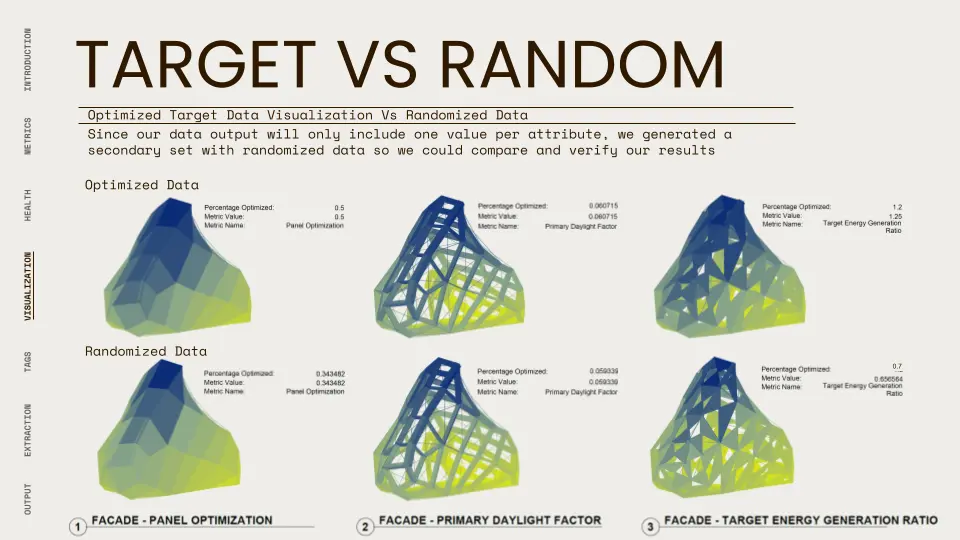
The integration of verification protocols, such as deploying secondary randomized datasets, ensures that the visual feedback is always mathematically flawless.
Ultimately, this system wrapper transforms Revit from a static documentation tool into a dynamic, living dashboard where multi-criteria optimization is rendered visibly, intuitively, and continuously, fundamentally enhancing how large architectural practices manage and present complex project health.
The System At Work
To rigorously validate this integrative modeling workflow, we deployed the tool on our proprietary project.
This massive, mixed-use architectural endeavor provided the perfect stress test, requiring the synthesis of highly complex, disparate performance data generated by five independent design teams: Facade, Residential, Industrial, Services, and Structural.
The primary goal was to ensure the Rhino.Inside Revit pipeline could accurately ingest, process, and visualize this multi-criteria data natively within a heavy BIM environment without causing system instability or data corruption.The testing phase began with the data extraction protocol.
The project consisted of 92 individual Speckle models representing various fragmented geometries and analyses. We tested the system's ability to pull cumulative component values, such as the Industrial team's "Energy Self-sufficiency Ratio," the Facade team's "Primary Daylight Factor," and the Structural team's "Embodied Carbon Efficiency."
The custom dashboard successfully aggregated these metrics, outputting clean CSV files containing the calculated values alongside their specific target goals. Next, we evaluated the Metric Normalization Engine within Grasshopper.
Because the incoming metrics utilized completely different units (e.g., Kilowatt Hours vs. Square Meters), direct comparison was natively impossible. We monitored the script as it processed each value against its goal, successfully generating a percentage of improvement or shortcoming. Crucially, the engine flawlessly converted these diverse percentages into a unified 0.0 to 1.0 mathematical scale.
To mathematically verify this logic before visual deployment, we injected a secondary dataset of randomized numbers into the script. The engine processed the randomized data with perfect accuracy, proving the robustness of the normalization algorithms.
With the data verified, we initiated the visual integration test using the Rhino.Inside Revit bridge. We mapped the five conceptual massing elements from the initial design phase to represent the five teams. The Grasshopper definition was tasked with pushing the normalized 0.0-1.0 scale data into these geometric proxies.
The real-time visual feedback systems responded perfectly. The script successfully bypassed manual Revit inputs, directly controlling the software’s Material systems to apply a smooth red-to-green gradient across the masses. The mass representing the top-performing team turned bright green, while the underperforming team's proxy rendered in red, providing an immediate, undeniable hierarchy of project health.
We further stressed the visual systems by testing the Graphic Overrides for individual metrics. The tool successfully applied a distinct blue-to-yellow gradient across eleven specific 3D views, isolating secondary and tertiary metrics (like "Panel Optimization" and "Recycled Water Ratio") to provide granular visual analysis without disrupting the primary material gradients.
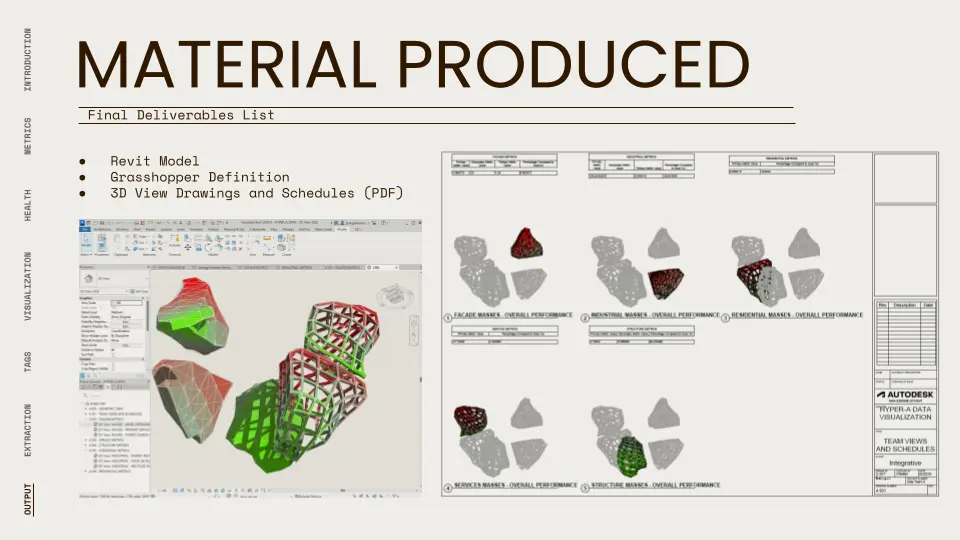
The final phase of the test focused on automated documentation. We monitored the flow of calculated parameters into native Revit Shared Parameters. The custom-built Tag Families (designed specifically for Primary, Secondary, and Tertiary metrics) immediately recognized the incoming data. They automatically snapped to the conceptual masses, accurately displaying the complex alphanumeric strings and percentage data within the 3D viewport.
Furthermore, standard Revit schedules populated instantly with the Grasshopper-calculated metrics. This flawless execution confirmed that project managers and lead architects no longer need to parse through dense spreadsheets to understand cross-disciplinary optimization. Instead, they can navigate a living 3D model that clearly communicates its own health through color-coded massings and automated tags.
The success of this stress test validates the immense commercial potential of parametric-to-BIM integration, setting a new standard for performance-driven design methodologies in large-scale urban development.
Visualizing BIM Intelligence

Real-Time Visual Feedback
The integration successfully bridged parametric data and BIM geometry, providing instantaneous visual feedback on project health. By automating Revit's Material and Graphic Override systems, complex numerical data was instantly translated into intuitive red-to-green and blue-to-yellow gradients. This allowed stakeholders to visually comprehend the relative performance of different design disciplines at a single glance, eliminating the cognitive load of cross-referencing external spreadsheets and significantly accelerating the architectural review process during critical design phases where rapid iteration is essential for project success.
Unified Metric Normalization
The computational engine proved capable of ingesting entirely disparate performance data (from structural embodied carbon to residential daylighting factors) and mathematically normalizing them onto a single 0.0 to 1.0 scale. This standardization is a major breakthrough, as it enables direct, equitable performance comparisons across vastly different architectural disciplines. By establishing this universal baseline, project managers can objectively rank team optimizations, identify critical underperformance, and allocate resources efficiently based on strictly mathematical, bias-free project intelligence embedded directly in the model.
Automated BIM Documentation
The workflow completely eliminated the need for manual data entry within the documentation phase. By pushing complex Grasshopper calculations directly into Revit Shared Parameters, the system automatically populated highly detailed architectural schedules. Furthermore, the deployment of custom-built Tag Families allowed the 3D views to label themselves, instantly displaying primary, secondary, and tertiary performance metrics directly attached to their respective geometric proxies. This automation drastically reduces the potential for human error in documentation, ensuring that the deliverables presented to clients and engineers are always perfectly synchronized with the latest algorithmic performance data generated by the computational design team.
Flawless Multi-Model Aggregation
The successful data extraction protocol demonstrated the platform's robust capacity to handle massive, fragmented digital environments. Utilizing SpecklePy, the system accurately aggregated cumulative component values from 92 distinct models associated with the Hyperbuilding A project. This capability ensures that the visualization engine is highly scalable and perfectly suited for enterprise-level developments where dozens of separate teams are contributing to a single, massive central file. The flawless processing of both target and secondary randomized datasets confirmed the total reliability of the underlying computational logic, securing investor and stakeholder confidence in the visualized data and overall project trajectory.
What All of This Means for the AEC Industry
The commercial impact of this Integrative BIM Performance Visualizer is profound, directly addressing a high-value gap in the Architecture, Engineering, and Construction (AEC) market.
Large-scale architectural practices frequently expend massive capital on highly specialized computational design teams to run complex multi-criteria optimizations.However, the value of that data is severely bottlenecked if it cannot be easily communicated to clients, project managers, and investors who operate outside of algorithmic environments like Grasshopper.
By seamlessly translating abstract metrics into intuitive, visually striking 3D gradients native to Revit, this tool bridges the gap between deep computation and executive decision-making.
This capability holds immense premium value as a design decision support service, commanding implementation fees between $50,000 and $300,000 per large developments.
It transforms dry sustainability reports and structural audits into compelling, easily digestible visual narratives. When pitching to stakeholders, a developer can display a living BIM model that visually proves its own efficiency, showing a brilliant green massing to denote perfectly optimized energy self-sufficiency or daylighting factors.
This level of visual proof of real-time data is invaluable for securing funding, passing strict municipal reviews, and winning competitive architectural bids. Furthermore, as an internal project management add-on, this normalized metric framework acts as a highly effective team performance dashboard.
Lead architects can instantly identify which disciplines are dragging down the project's overall efficiency and intervene weeks earlier than traditional workflows allow. By eliminating the manual labor associated with updating schedules and tags across multiple disciplines, the tool drastically reduces billable hours wasted on tedious documentation.
Ultimately, this integration elevates the standard of deliverables, positioning firms that utilize it at the bleeding edge of performance-driven design, and turning complex computational data into a highly visible, highly marketable competitive advantage in the global real estate sector. It ensures that every ounce of algorithmic intelligence generated during the design process is directly monetized and visually communicated to the final client.

The Beggining of A New Standard in Data-Driven Design
Integrative workflows such as the implementation of this Rhino.Inside Revit workflow within the wider AEC industry establishes a new benchmark for Parametric-to-BIM integration.
Designed specifically for large architecture firms of 50 to 500 employees, this tool integrates smoothly into established Revit standards without requiring firms to abandon their existing protocols.
Because the heavy computational logic is handled via Grasshopper on the backend, standard BIM operators do not need advanced coding skills to benefit from the automated visualizations. They simply manage the Revit environment while the geometry updates its own material gradients and custom tags based on the incoming shared parameters.
This methodology encourages an unprecedented level of interdisciplinary collaboration. Structural engineers, sustainability consultants, and facade designers can continue working in their specialized analytical software, while this integrative engine aggregates their diverse CSV outputs into a single, cohesive visual dashboard within the central Revit model.
This implementation standardizes the way abstract performance data is documented, turning subjective design reviews into objective, data-driven assessments.
As the industry continues to prioritize strict environmental and financial performance metrics, tools that can visually communicate these optimizations in real-time will become mandatory.
By establishing a robust workflow that links algorithmic logic directly to native Revit families and graphic overrides, firms can transition from static, after-the-fact performance reporting to proactive, real-time performance steering, fundamentally improving the quality and efficiency of the built environment.
This strategic implementation ensures that architectural practices can scale their computational capabilities effortlessly, remaining highly competitive in a fast-paced market.
FAQ
1. How does this integrative tool visualize abstract performance data?
The tool visualizes abstract performance data by establishing a direct, automated link between computational environments like Grasshopper and native BIM platforms like Revit. It takes complex, numerical performance metrics (such as daylighting factors or embodied carbon efficiencies) and maps that data onto 3D geometric proxies within the model. Using advanced scripting via the Rhino.Inside Revit ecosystem, the system automatically controls Revit's Material and Graphic Override settings. It translates the numerical data into intuitive color gradients, such as a red-to-green scale, where green represents optimal performance and red indicates underperformance. This process allows stakeholders to visually comprehend massive amounts of highly abstract, multi-disciplinary data at a single glance. Instead of parsing through dense spreadsheets, project managers and clients can review a living 3D model that clearly communicates its overall health and specific structural optimizations through dynamic, data-driven color coding. This seamless translation of mathematics into visual architecture fundamentally accelerates the design review process and ensures that all project collaborators are immediately aware of the design's current efficiency levels. By automating this visual feedback loop, the tool ensures that every critical performance metric is physically represented within the standard construction documentation environment, leaving no critical data hidden from view.
2. How does the system compare metrics from different disciplines?
Comparing metrics from completely different architectural disciplines is a major challenge because they utilize fundamentally different units of measurement, such as kilowatt-hours for energy generation versus square meters for spatial efficiency. To solve this, the tool relies on a highly sophisticated Metric Normalization Engine built within Grasshopper. When the system ingests the raw data via CSV files, it processes each discipline's specific metric against its pre-defined target goal. By executing complex mathematical comparisons, the engine calculates the exact percentage of improvement or shortcoming for that specific discipline. Most importantly, the algorithm then normalizes all of these diverse percentages onto a strict, universal 0.0 to 1.0 mathematical scale. By forcing all abstract data into this unified framework, the system strips away the disparate units of measurement and leaves behind a pure performance ratio. This standardized 0.0 to 1.0 scale is what drives the visual gradients in Revit, allowing a project manager to objectively compare the success of a facade's panel optimization directly against the efficiency of a structural engineer's load capacity. This creates an equitable, data-driven environment for evaluating the holistic health of a complex project. It eliminates subjective interpretations of success by ensuring every team is judged on the exact same relative scale. This rigorous mathematical standardization is essential for large-scale enterprise developments where resource allocation and critical design adjustments must be executed rapidly based on flawless, comparable intelligence across all integrated design sectors.
3. Can this workflow automate standard BIM documentation and tagging?
Yes, a primary advantage of this Rhino.Inside Revit workflow is its ability to fully automate the documentation of complex computational data. In traditional workflows, transferring abstract performance metrics into BIM schedules and tags is a highly tedious, manual process prone to human error. This tool bypasses that friction entirely. The Grasshopper definition is scripted to push the normalized metric data, percentage comparisons, and raw calculation values directly into native Revit Shared Parameters. We engineered custom Tag Families specifically designed to read these parameters. As soon as the data enters the Revit ecosystem, these intelligent tags automatically attach to their respective geometric massings, displaying the complex alphanumeric strings and performance data directly in the 3D viewport and on standard 2D drawing sheets. Simultaneously, standard Revit schedules populate instantly with the updated computational metrics. This guarantees that all deliverables, schedules, and visual tags are perfectly synchronized with the latest algorithmic data, drastically reducing billable hours spent on manual documentation. This seamless automation ensures absolute data integrity from the parametric testing phase straight through to final construction documentation, allowing architectural teams to focus on design iteration rather than administrative data entry tasks. By embedding this intelligence directly into the BIM environment, firms ensure that performance tracking is not an afterthought, but a continuously updated, integral component of the project's official architectural record.
4. How is data extracted from multiple design teams into the system?
In large-scale developments, project data is often highly fragmented across numerous specialized teams and models. To aggregate this intelligence, our system utilizes SpecklePy to establish a robust, centralized data extraction pipeline. For example, during the Hyperbuilding A deployment, we needed to synthesize cumulative component values from 92 individual Speckle models generated by five independent design teams. The pipeline intercepts these disparate data streams (pulling total energy generation values from the Industrial team and total panel areas from the Facade team) and aggregates them into a unified dashboard. This system then outputs the structured intelligence as highly organized CSV files. The Grasshopper backend of our integrative tool is designed to read these specific CSV files continuously. This separation of extraction and processing allows the individual design teams to work flexibly in their preferred software environments without being forced to learn new protocols. They simply upload their latest cumulative metrics, and the pipeline handles the complex task of formatting that data for the normalization engine. This methodology ensures a smooth, uninterrupted flow of information from abstract architectural algorithms directly into the visual BIM environment. By utilizing open-source data exchange frameworks, the workflow remains highly scalable, capable of managing the massive data loads associated with enterprise-level urban planning without causing latency or system crashes within the primary Revit models. This centralized aggregation is the critical first step in achieving holistic project visualization.
5. Does implementing this tool require advanced coding skills for the user?
No advanced coding skills or computational design experience are required for the end-user operating the BIM environment. A core objective of this integrative approach is to democratize advanced multi-criteria optimization by bridging the gap between specialized parametric developers and standard architectural production teams. The highly complex Python scripting, Grasshopper definitions, and mathematical normalization engines are all processed silently on the backend via the Rhino.Inside Revit infrastructure. The standard BIM operator simply manages their native Revit environment as usual. When the computational team updates the CSV data, the backend algorithms automatically drive the Revit API, updating the Material gradients, Graphic Overrides, and custom Shared Parameters without requiring any manual scripting or intervention from the Revit user. This seamless integration ensures that large architecture firms can implement cutting-edge performance visualization tools without retraining their entire workforce. It allows structural engineers and BIM managers to benefit instantly from dynamic, automated visual feedback and intelligent tagging, significantly enhancing their decision-making capabilities while relying entirely on the familiar interface of their standard documentation software. By concealing the complex computational mechanics behind a user-friendly BIM implementation, the system ensures rapid adoption across enterprise-level practices. It successfully translates the esoteric language of algorithmic design into the universally understood visual language of 3D architecture, making high-end performance optimization accessible to every stakeholder involved in the project lifecycle. This separation of computational processing and visual output guarantees maximum efficiency and usability.