
HYPER-DATA
A centralized data infrastructure unifying multidisciplinary design teams through automated interoperability, real-time analytics, and custom dashboard visualization for complex architectural developments.

The power of a data-driven ecosystem
We engineered a centralized digital nervous system for the "Ensō Hyper-Building," transforming fragmented design workflows into a unified, data-driven ecosystem. By leveraging Speckle and Python, we enabled six distinct disciplines to collaborate in real-time, visualizing complex KPIs through a custom-built, interactive dashboard.
.png)
Hyperscale = Hypercomplexity
Designing a "Hyper-Building" presents a monumental coordination challenge. In traditional workflows, multidisciplinary teams (Structure, Façade, Industrial, etc.) operate in isolation, creating "black box" data silos. Information exchange is often manual, slow, and prone to version control errors.
For this project, the sheer scale of the Ensō Hyper-Building meant that a lack of interoperability would lead to immediate failure. The Structural team needed to know how the Industrial team’s load impacted their columns; the Façade team needed to react to the Residential team’s solar requirements. Without a central nervous system, these dependencies would result in clashes, redundant modeling, and "dead" data that offers no actionable insights.
Furthermore, defining success was difficult. Each team had individual goals, but there was no unified metric to assess the building’s overall performance. We faced the problem of "data noise", having too much information but no intelligence. We needed a way to not just store geometry, but to extract, validate, and visualize performance metrics (KPIs) in real-time, ensuring that every design move contributed to the project’s overarching philosophy of circularity and completeness. The challenge was not just technical, but cultural: convincing creative teams to adopt rigid naming conventions and metadata standards to enable this high-level automation.
A neuralgic approach
Our intention was to act as the project's central processing unit, shifting the role of the architect from "geometry creator" to "system integrator." We established a strict Data Management Strategy based on the concept of a Centralized Data Environment (CDE), utilizing Speckle as the interoperability hub.
We began by defining the "rules of engagement." We developed comprehensive protocols for naming conventions, metadata tagging, and version control. This ensured that every data packet (whether a structural column or an energy consumption metric) was machine-readable and traceable. We treated the building data not as static files, but as fluid streams.
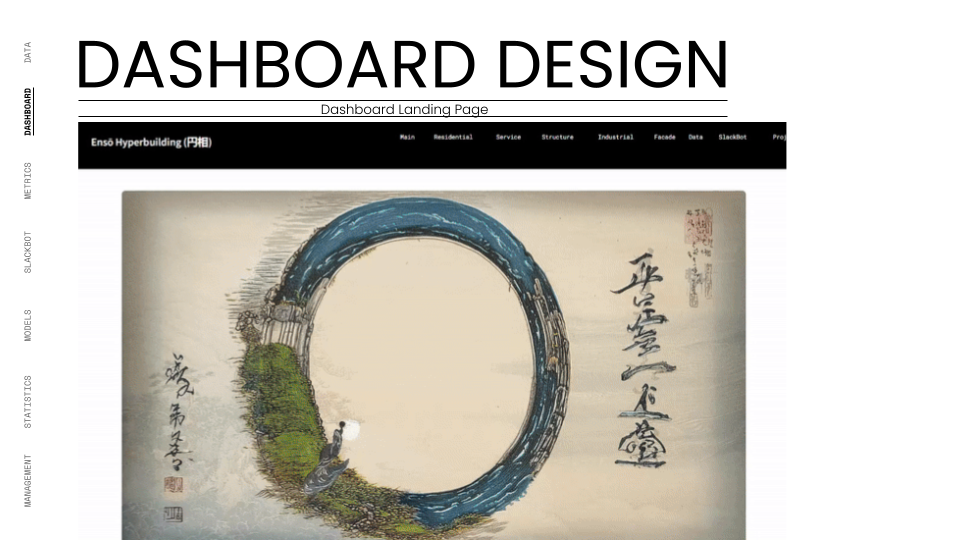
To unify the teams, we aligned our data strategy with the project’s philosophical core: the Japanese concept of Ensō (the Zen circle). Just as the Ensō represents a continuous cycle, our data workflow was designed as a closed loop. We implemented automated scripts that pulled data from Rhino and Grasshopper, processed it through Python, and pushed it to a custom-built Streamlit dashboard.
This allowed us to move from reactive coordination to proactive optimization. Instead of waiting for weekly meetings to spot issues, we built a Slackbot that pushed "micro-dashboards" to team channels, providing instant feedback on their KPIs. We balanced standardization with creativity; while the data structure was rigid, the teams had the freedom to innovate within their domains, knowing their outputs would integrate seamlessly. This approach turned data into a design material, as malleable and essential as concrete or steel.
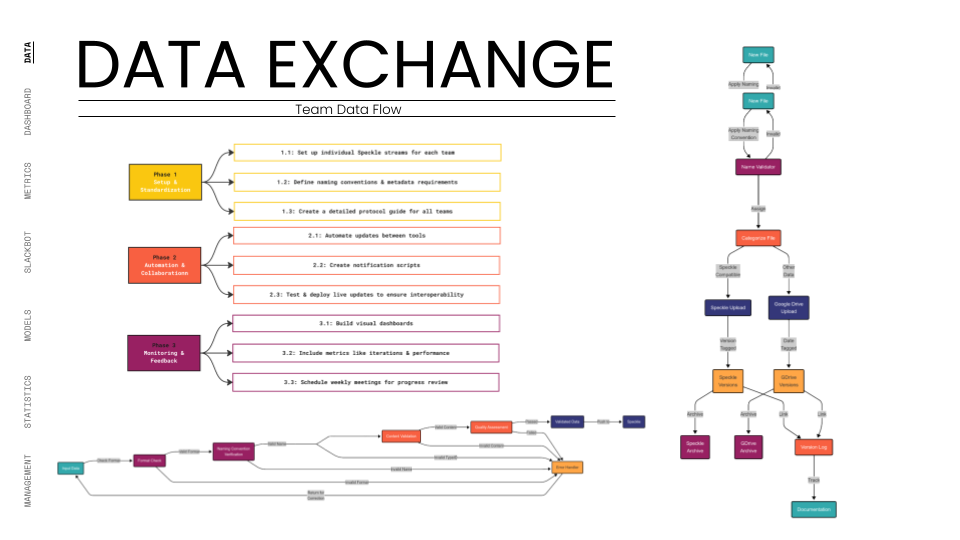
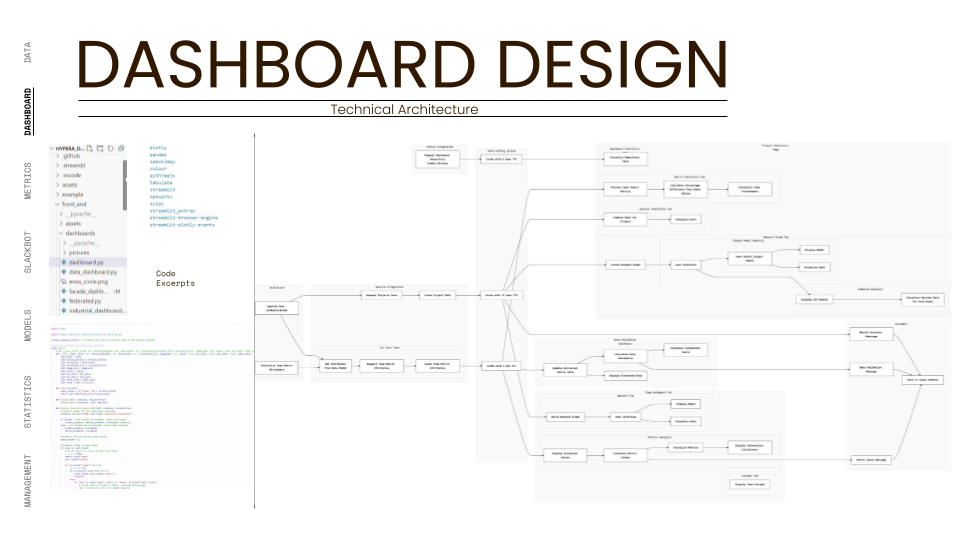
Automating Pipelines
The ecosystem relies on a stack of Rhino/Grasshopper for generation, Speckle for transport, and Python/Streamlit for visualization. It is an automated pipeline where geometry inputs trigger calculation outputs, closing the feedback loop instantly for all stakeholders.


Protocol & Standardization:
Before any geometry was modeled, we deployed a rigorous Data Governance framework. We defined precise naming conventions (e.g.,
hypera_facade_windows_simplified), folder structures, and metadata requirements. This standardization was the "language" that allowed different software and teams to speak to one another without translation errors.
The Speckle Hub:
Speckle served as our interoperability engine. We set up dedicated streams for each discipline (Structure, Residential, Services, etc.). This allowed for granular version control and "permissioned" data flow, ensuring that teams could pull the latest context geometry (like the building core) directly into their workspace without file-heavy transfers.

Automated Extraction:
We wrote custom Python scripts to act as data miners. These scripts recursively searched through the Speckle streams to extract specific attributes—KPIs like "Energy Self-Sufficiency" or "Daylight Factor." This automation eliminated manual data entry, ensuring that the metrics displayed were always a true reflection of the current model state.
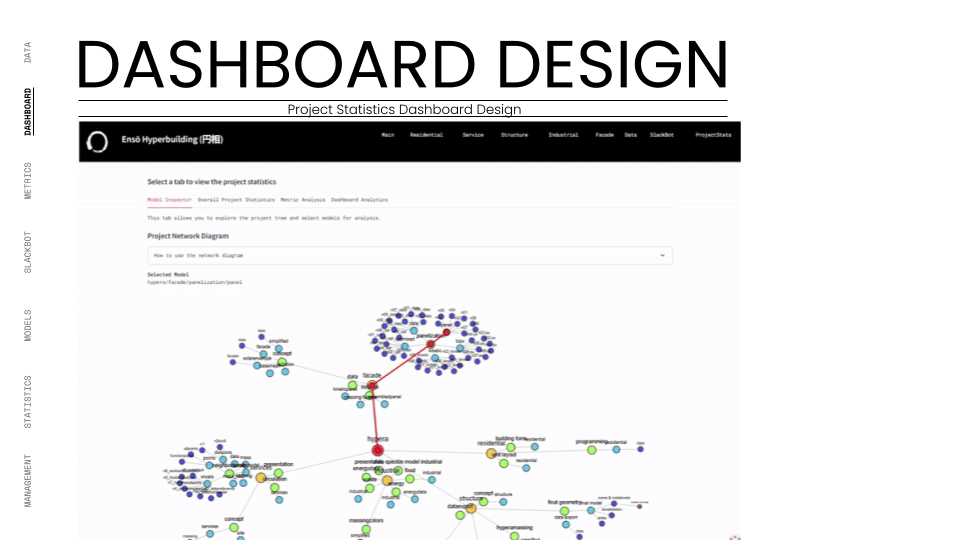
The Dashboard:
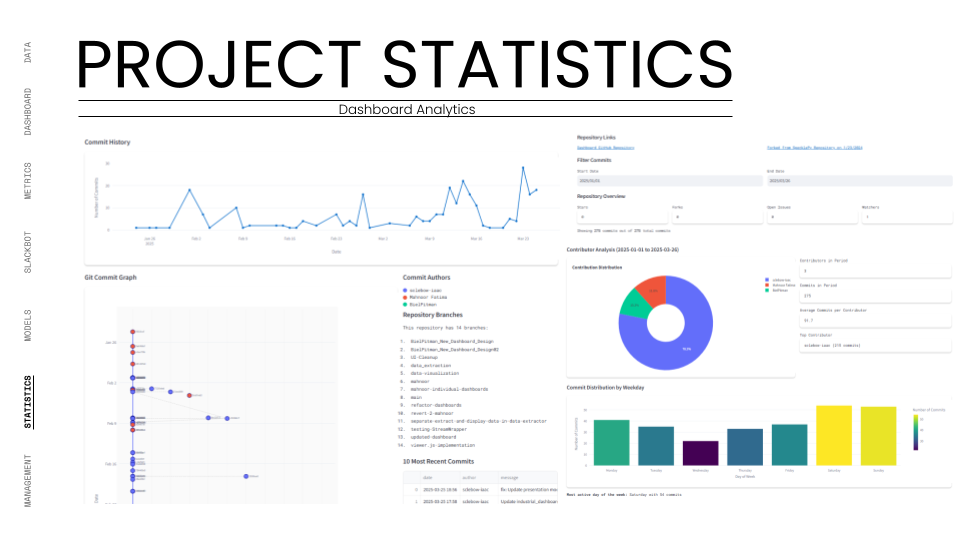
The front-end was a bespoke web app built with Streamlit. It served as the project's "mission control," visualizing the extracted data. It featured interactive calculators, 3D model viewers, and comparative graphs, allowing stakeholders to view both individual team performance and the holistic health of the Hyper-Building.
Feedback Loops:
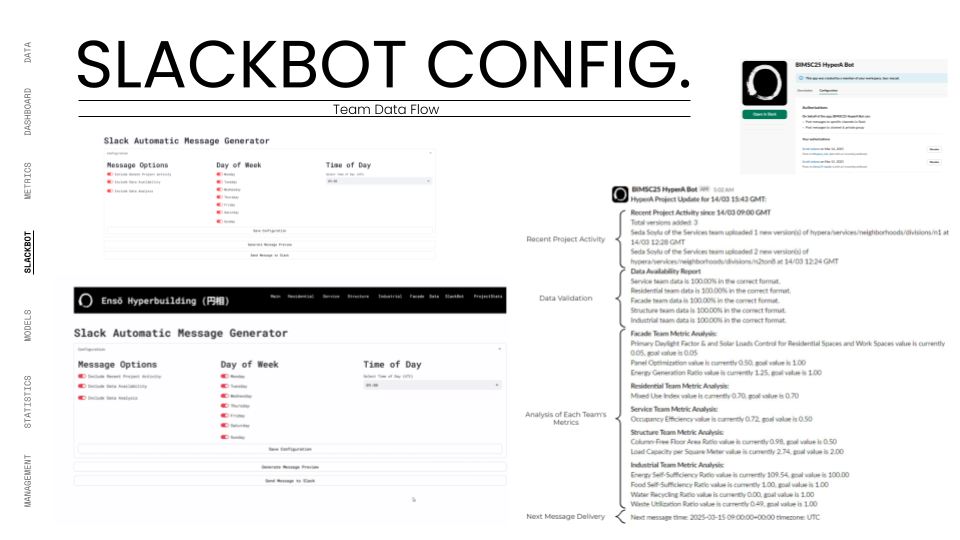
To keep the cycle active, we integrated a custom Slackbot. This bot monitored the data streams and automatically posted updates, alerts, and "mini-reports" to the team communication channels. This pushed data to the users where they worked, ensuring immediate awareness of design changes or KPI milestones.
Orchestration:
This system represents a shift from "File-Based" to "Data-Based" architecture.
By wrapping the design process in this five-step infrastructure, we ensured that information was never lost, only transformed.
The "System" is not just the software; it is the workflow that enforces collaboration. It connects the "Industrial" team's waste output to the "Industrial" team's energy input, physically manifesting the Ensō philosophy of circularity through digital connections.
It effectively turned a collection of distinct models into a single, queryable database that could be analyzed, optimized, and visualized in real-time.
Scaling up deployment
We stress-tested this infrastructure over a 10-week development cycle for the "Ensō Hyper-Building," a massive vertical city project involving six distinct design teams: Industrial, Structure, Façade, Residential, Service, and Data.
The test began with Phase 1: Setup and Standardization. In the first three weeks, we onboarded all teams to the Speckle workflow. We challenged the infrastructure by demanding that 100% of the project’s geometry and non-geometric data be hosted on our central streams. We established strict OKRs (Objectives and Key Results) for data adoption. For instance, the Industrial team had to define inputs for energy generation, while the Residential team had to define outputs for waste. The system had to handle these disparate data types simultaneously.
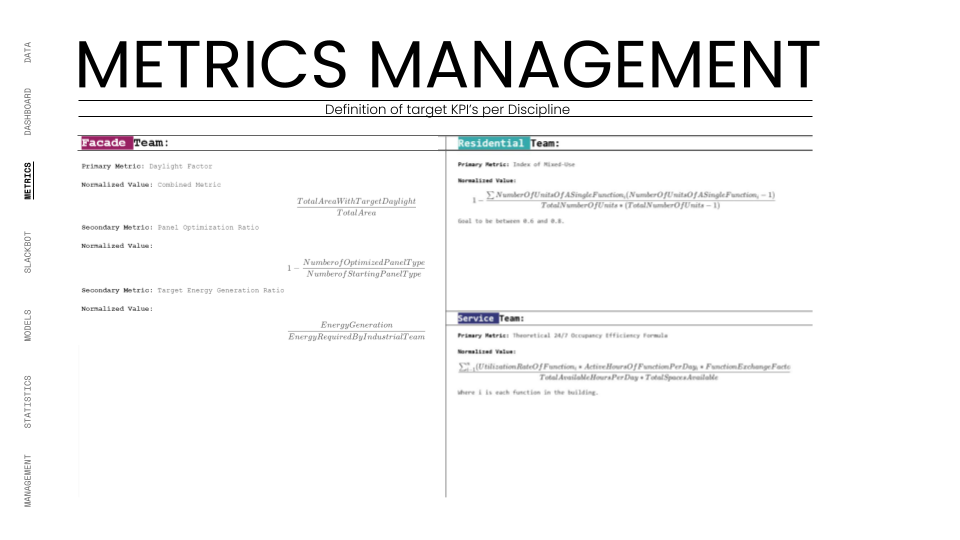
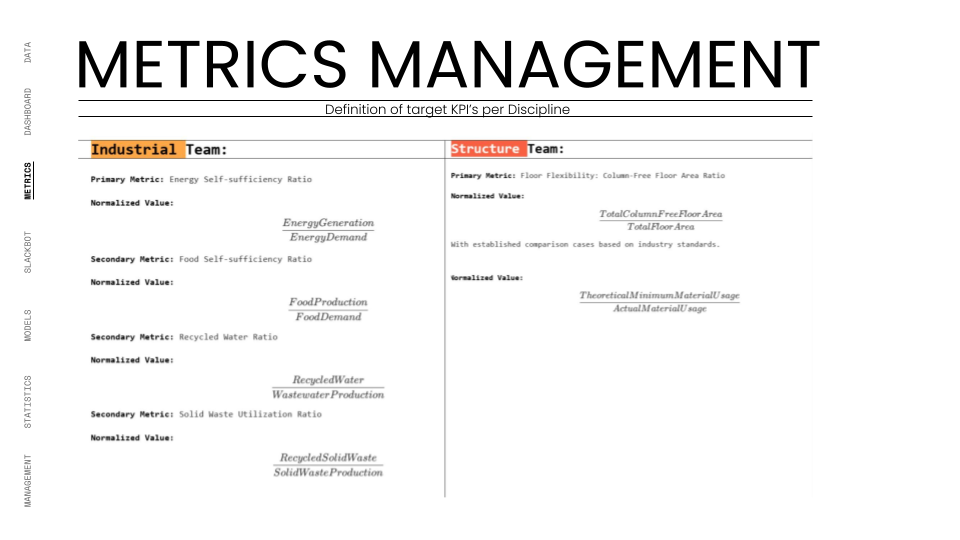
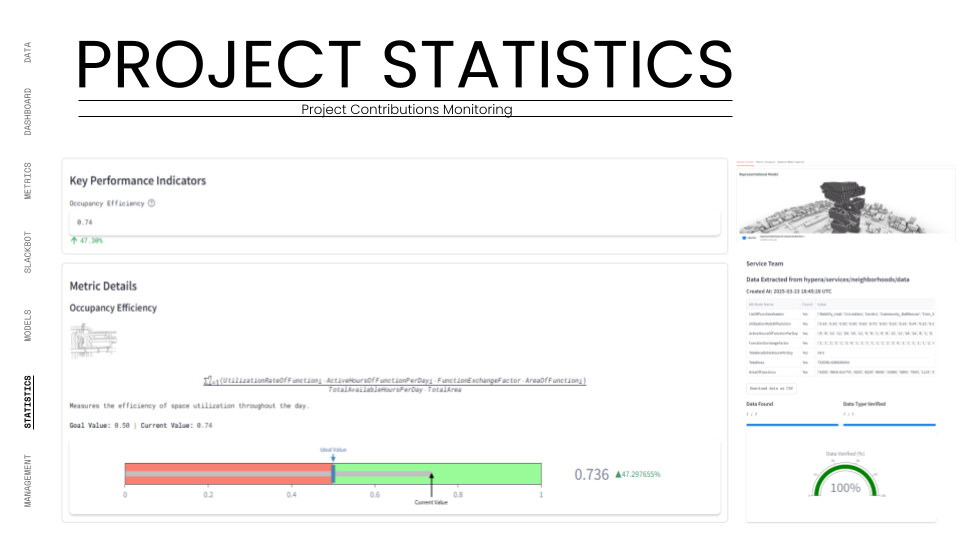
Phase 2: Automation and Collaboration pushed the system harder. We automated the "handshakes" between teams. When the Massing team updated the building form, the system automatically notified the Facade team to regenerate their panels. We tested the system's latency by requiring a maximum 24-hour data delay for cross-team updates. The real test here was the KPI Monitoring. We assigned specific metrics to each team, the Structure team was tracked on "Column-Free Floor Ratio," while the Service team was tracked on "Occupancy Efficiency." The system had to ingest these raw numbers, normalize them against our targets, and visualize them on the dashboard in real-time.
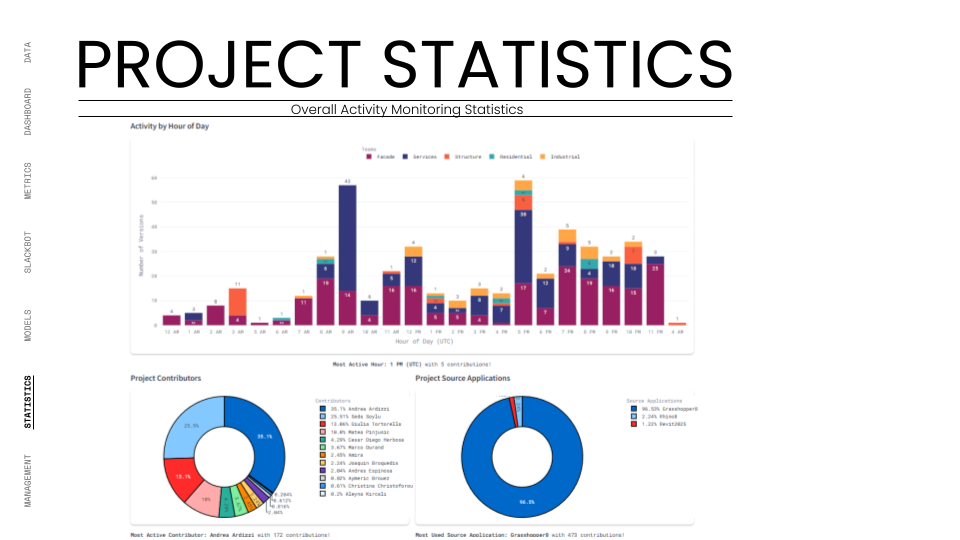
By Phase 3: Monitoring and Feedback, the system was managing a complex network of dependencies. We utilized the Dashboard to visualize the "Team Balance." We tracked the number of commits and versions to ensure no team was falling behind. The Slackbot became a critical stress-test component, firing off automated alerts whenever a KPI deviated from the agreed goal. For example, if the "Water Recycling Ratio" dropped below 100%, the Industrial team was instantly notified.
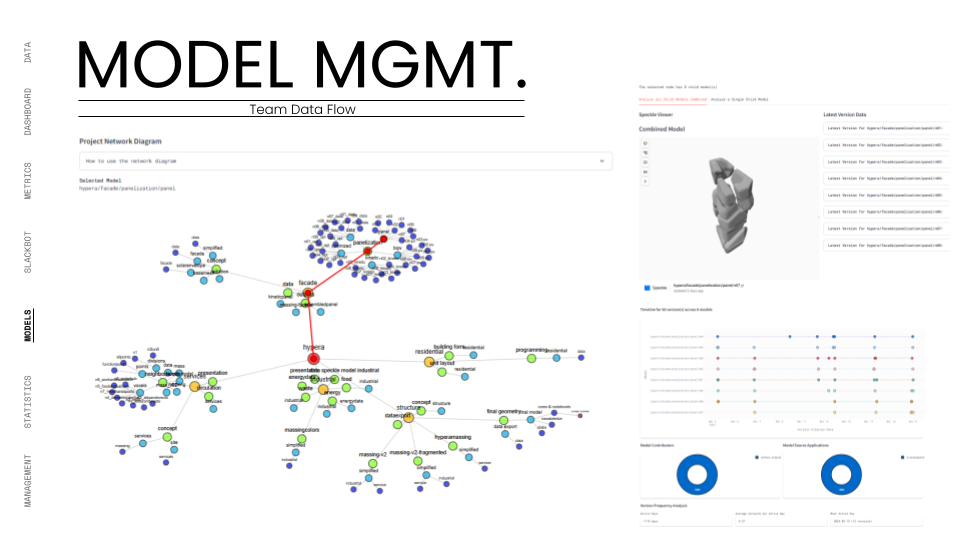
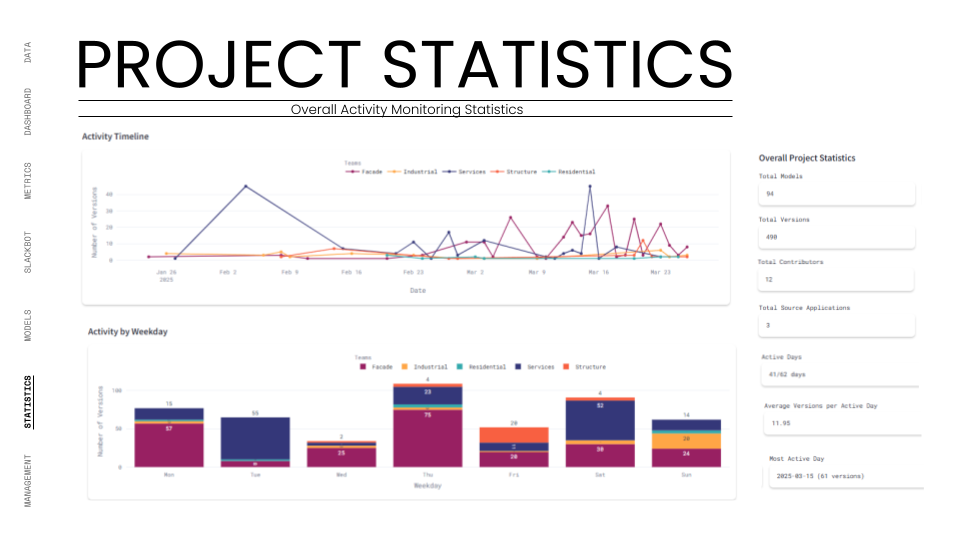
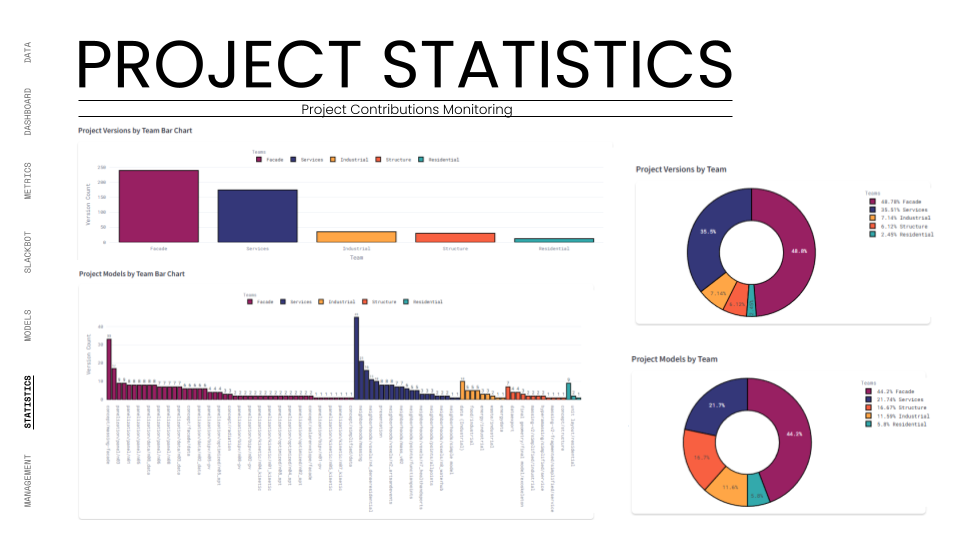
The ultimate test was the Federated Model. We used the dashboard to overlay all individual team models (structural cores, residential units, façade skins) into one lightweight web viewer. This required the system to parse and render gigabytes of geometry data through a browser interface without crashing. We successfully managed over 490 total versions across 94 unique models, proving that the infrastructure could handle the high-frequency iteration typical of a hyper-building project.
Unified Data Vision
Protocol Adoption
By the project's mid-term, we achieved 100% adoption of naming conventions and metadata standards across all six teams. This eliminated file-hunting and ensured every asset was instantly retrievable and machine-readable.
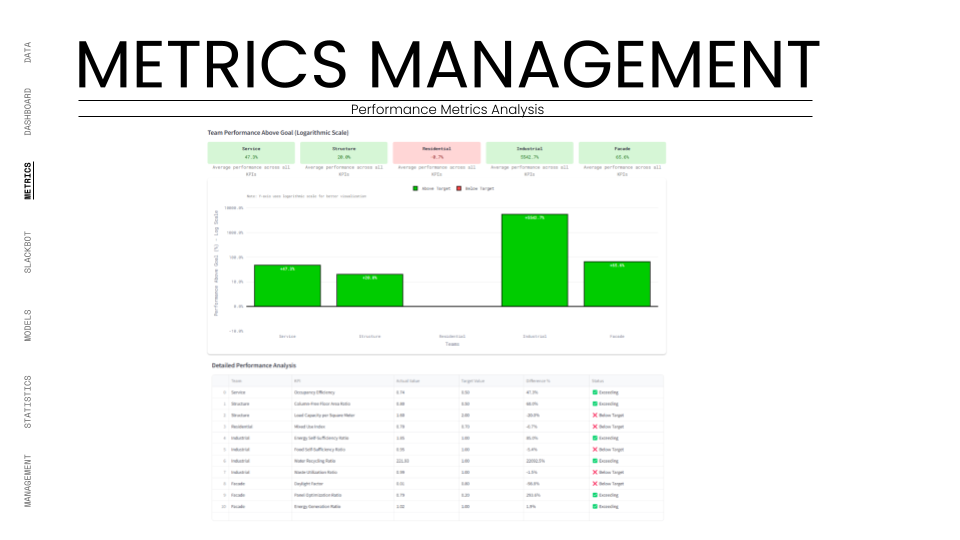
Real-Time KPI Tracking
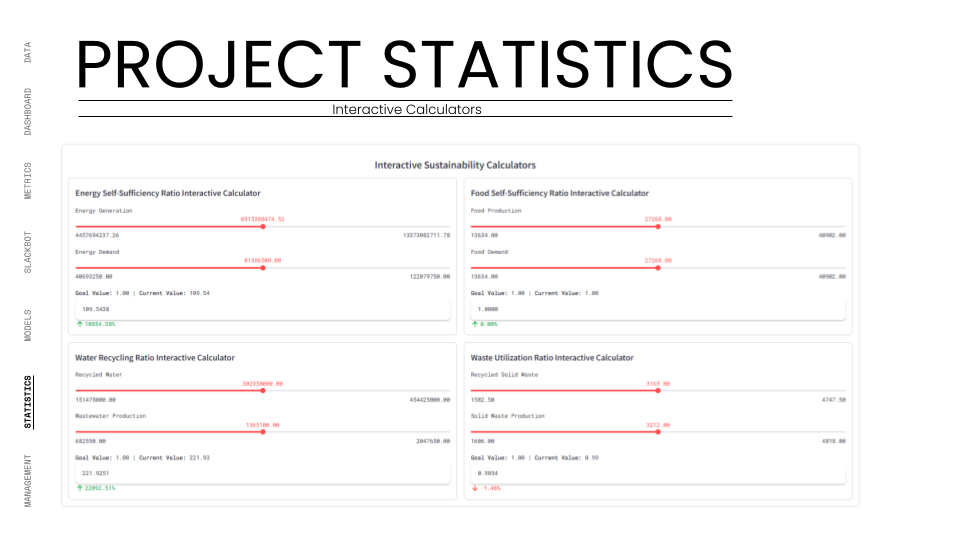
We successfully tracked complex metrics like "Energy Self-Sufficiency" (achieving 109%) and "Water Recycling" (221%) in real-time. The dashboard transformed abstract sustainability goals into concrete, trackable live data.
Automated Interoperability
We reduced cross-team coordination time significantly by automating data streams. Structural updates automatically informed façade parameters, creating a "living" model that reduced collision errors and manual rework.
Active Collaboration Culture
The implementation of the Slackbot and "Team Balance" metrics gamified the design process. We saw a sustained increase in daily commits, ensuring a continuous, healthy flow of data throughout the project lifecycle.
What This Means for our Clients
This project demonstrates a scalable service model for "Strategy Engineering." In the current AEC market, clients are drowning in data but starving for insights. This project proves our ability to step in as a "Data Master Planner," setting up the infrastructure that guarantees project success before design even begins.
By implementing this level of data rigor, we reduce the massive overhead associated with coordination meetings, file management, and error correction. We convert the design process into a transparent, measurable product. This allows developers and large firms to monitor their project's health—financial, environmental, and spatial—in real-time, rather than waiting for quarterly reports. It transforms the digital model from a static deliverable into a dynamic asset that drives decision-making.

Industry Implementation Impact
The AEC industry is rapidly moving toward Digital Twins and algorithmic design, yet data management remains archaic. This project serves as a blueprint for the future of "Integrated Project Delivery" (IPD). It moves beyond standard BIM (Building Information Modeling) to what we call "Hyper-BIM"—a web-based, API-first approach where geometry is secondary to the data it carries.
Implementing this strategy allows firms to break down the silos between engineering, design, and sustainability. It facilitates true circular economy practices by accurately tracking material flows (like the waste-to-energy loops we monitored) from concept to construction. As AI continues to enter architecture, organized, structured data like this is the prerequisite. This framework creates the "clean data" necessary to train future AI models for automated design optimization.
FAQ
What specific software stack and infrastructure are required to implement this centralized data ecosystem?
The ecosystem is built on a "headless" data infrastructure that prioritizes API connectivity over proprietary file formats. The core technological stack is divided into three distinct layers: Generation, Transport, and Visualization.
For Generation, we utilize Rhino and Grasshopper. These tools are not just used for modeling but serve as the primary data inputs where parametric logic defines the building's geometry and metadata. Unlike traditional BIM workflows that trap data in heavy files, our workflow treats geometry as lightweight data packets.
For Transport, the backbone of the system is Speckle, an open-source data platform for the AEC industry. Speckle acts as our "Single Source of Truth" (SSOT), replacing static file servers. It manages version control, user permissions, and object-level data streaming, allowing us to send specific building components (like a structural core) to other teams without exchanging the entire model.
For Visualization and Logic, we employ Python and Streamlit. Custom Python scripts serve as the "miners," extracting raw data from Speckle streams, validating it against our project protocols, and normalizing it for analysis. Streamlit then renders this processed data into an interactive, web-based dashboard. This stack is supported by standard productivity APIs, including Slack for automated notifications and Google Drive for archival storage, creating a fully integrated "Digital Nervous System" for the project.
How does this data strategy resolve the common industry problem of fragmented design silos?
Fragmentation in the AEC industry typically arises because different disciplines (Structural, Industrial, Façade) operate in isolated software environments, creating "black box" silos where data is inaccessible to others until a scheduled export occurs. Our strategy dismantles these silos by shifting the operating model from "coordination by meeting" to "coordination by system."
We implemented a Centralized Data Environment (CDE) where interoperability is automated rather than manual. By defining a universal "TypeID" system and strict naming conventions early in the project, we created a shared language that all teams—regardless of their specific discipline—must speak. This means that a change in the Industrial team's waste output parameters is immediately legible to the Residential team's inputs because both share the same metadata structure.
Furthermore, our system utilizes "Dependency Tracking" via the Speckle Network Graph. We can visualize exactly how a specific model version from one team influences the work of another. If the Massing team pushes a new building envelope, the system flags this update for the Façade team, ensuring that no one is working on outdated constraints. This effectively turns the project into a single, cohesive organism where information flows horizontally across disciplines in real-time, rather than being stuck in vertical silos, ensuring that the "Ensō" philosophy of continuity is applied to the digital workflow itself.
Can this framework quantify and visualize complex environmental and performance metrics in real-time?
Yes, real-time performance quantification is the core value proposition of this framework. In traditional projects, sustainability metrics are often calculated post-design in a "forensic" manner. Our approach integrates these calculations directly into the design loop via a "Data-Driven Design" (DDD) methodology.
We established specific Key Performance Indicators (KPIs) for each discipline—such as Energy Self-Sufficiency, Water Recycling Ratio, and Carbon Footprint. These are not static targets but dynamic formulas embedded in the Python logic of our dashboard. As teams push new geometry to Speckle, our scripts automatically harvest the relevant metadata (e.g., floor area, material volume, solar exposure) and run the calculations instantly.
The results are displayed on the Project Dashboard using a normalized scale (0 to 1), allowing us to compare disparate metrics side-by-side. For instance, we can instantly see if a structural optimization has negatively impacted the "Column-Free Floor Ratio" or if a façade change has improved the "Daylight Factor." This immediate feedback loop allows the design teams to gamify optimization, striving to keep their "Health Bars" green. It moves environmental analysis from a consultant's report into the daily workflow of the architect, ensuring that every design move is measured against the project's sustainability goals.
How does automation streamline the coordination process between distinct architectural and engineering disciplines?
Automation is deployed here to handle the "transactional" costs of collaboration. In a manual workflow, a simple update requires exporting files, uploading them to a server, emailing the team, and waiting for them to download and link the new file. We replaced this friction with an automated "Push/Pull" workflow managed by custom scripts.
Our system features a Slackbot Integration that acts as an automated project manager. It constantly monitors the Speckle streams for activity. When a critical update occurs—for example, if the Structural team commits a new core layout—the bot automatically posts a notification to the relevant project channels. This ensures that all downstream teams are instantly aware of the change without a human manager having to intervene.
Beyond notifications, we automated the data validation process. Before data is visualized, it passes through a "Gatekeeper" script that checks for adherence to naming conventions and metadata standards. If a submission fails this check, the user is notified to correct it. This "Automated Quality Control" ensures that the dashboard never displays corrupt or incomplete data. By offloading these repetitive coordination and checking tasks to algorithms, we freed up the human design teams to focus on creative problem-solving and high-level strategy, drastically reducing the latency of the decision-making process.
What is the tangible return on investment for developers adopting this hyper-building data strategy?
The Return on Investment (ROI) for this data strategy extends far beyond the design phase, offering significant value in construction and asset operations. For developers, the primary value is Risk Mitigation. By enforcing a "Single Source of Truth" and automated clash detection through data dependency tracking, we drastically reduce the likelihood of costly on-site errors and change orders caused by outdated information.
Secondly, this strategy accelerates the Speed to Market. The streamlined coordination and real-time decision-making capabilities allow for a compressed development schedule. Decisions that typically take weeks of back-and-forth emails are resolved in days using live dashboard data.
Finally, the most significant long-term ROI is the creation of a Digital Twin Foundation. Because the data is structured, standardized, and validated from day one, the final handover is not just a set of drawings, but a queryable, machine-readable database of the entire asset. This "clean data" is a prerequisite for advanced building operations, predictive maintenance, and future AI integration. It transforms the architectural model from a static deliverable into a dynamic, appreciating digital asset that reduces operational costs over the building's lifecycle. This shifts the perception of data management from an overhead cost to a strategic capital investment.