
Harnessing the power of data-driven design
Our Property Valuation Model turns old Excel guesswork into a robust machine tool. By using Boston data features , we give reliable market predictions with 91% accuracy. This lets teams automate checks, replacing biased analysis with fast, scalable, true insights. We now show real market value.
.png)
.png)

Investment Uncertainty
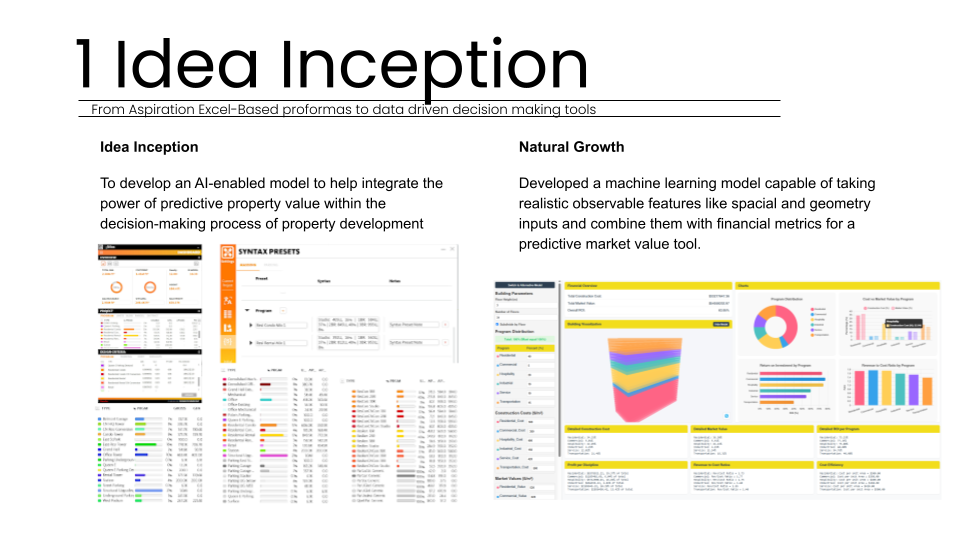
Traditional property valuation relied on manual proformas that were consistently time-consuming, subjective, and aspirational. These manual methods lacked scaling capabilities, making it extremely difficult for developers to evaluate multiple acquisitions in a timely manner. This often resulted in weeks of inconsistent analysis based on Excel-based guesswork rather than objective data. Consequently, our team identified a critical need for a system capable of automating this process using observable property features.
To address this, we analyzed the Boston Property Assessment Data, which contained 182,241 properties and 76 columns. However, this dataset presented significant data quality problems that required strategic encoding before any modeling could begin. Our missing data analysis revealed a severe problem, as seven specific columns had over 80% missing data and had to be dropped.
Beyond missing values, the dataset suffered from extreme cardinality, featuring 201 unique building types. Furthermore, monetary fields were stored as text with currency symbols, complicating direct calculations. We also identified a data leakage risk from assessment-derived features that could make the model overconfident. These findings highlighted that raw data required a fundamental and systematic transformation. We decided to focus on a property valuation model specifically because this Zillow-sourced data was easier to obtain than RS Means construction cost data. This shift allowed us to prioritize building a robust predictive market value tool capable of transforming messy real-world data into reliable decision-making insights for our focused multi-family case study. These deep systemic issues necessitated an advanced machine learning solution developed today.
Intense Houekeeping
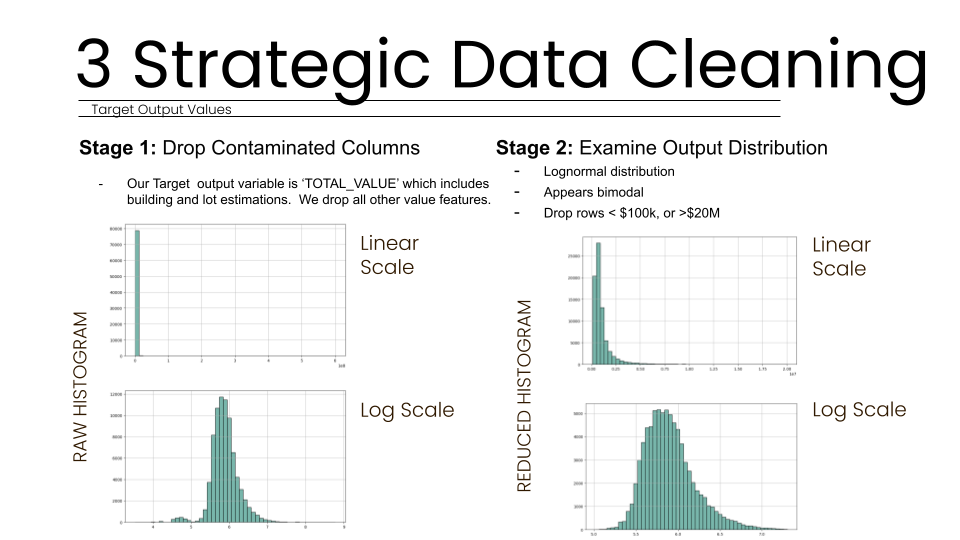
To address the inherent messiness of real-world property data, we developed a rigorous, multi-stage cleaning and encoding pipeline designed for maximum predictive accuracy. The first stage of our approach focused on strategic data cleaning to ensure model coherence. We identified and dropped seven columns where over 80% of the data was missing, as these could not provide reliable signals. We specifically dropped contaminated columns to mitigate the risk of data leakage, ensuring our model remains realistic for deployment on unassessed properties.
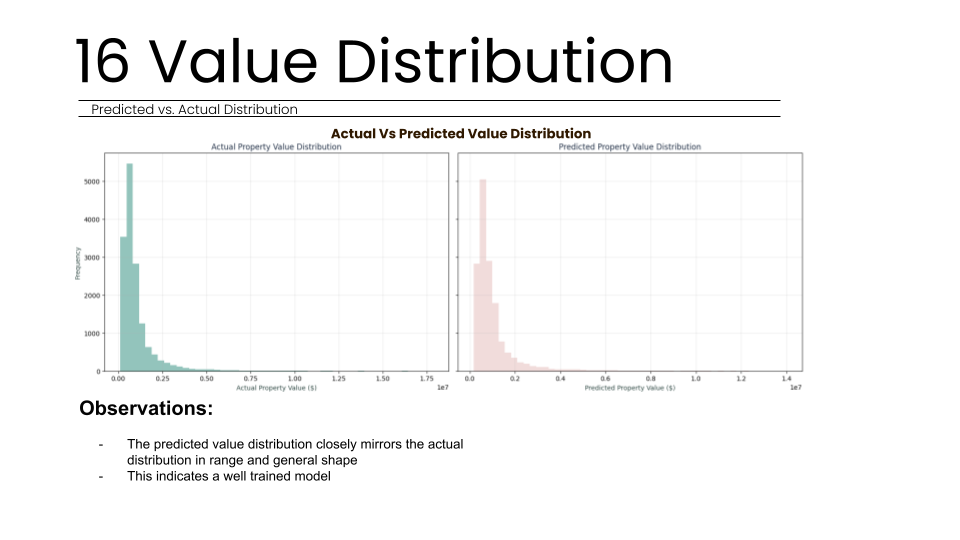
In the second stage of cleaning, we examined the output distribution of our target variable, "TOTAL_VALUE". We found that property values followed a lognormal distribution, which appeared bimodal due to varying building types across Boston. To remove statistical outliers, we filtered the dataset to include only properties valued between $100k and $20M.
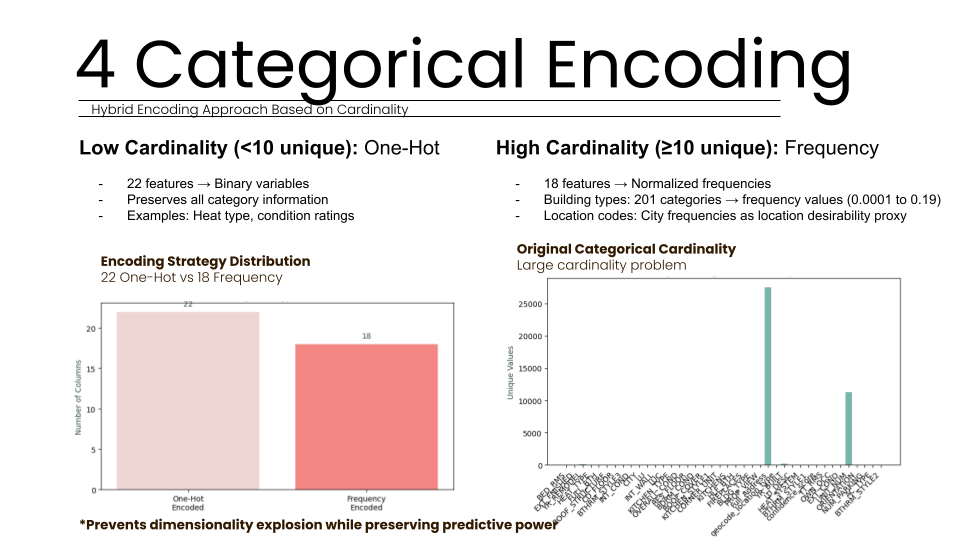
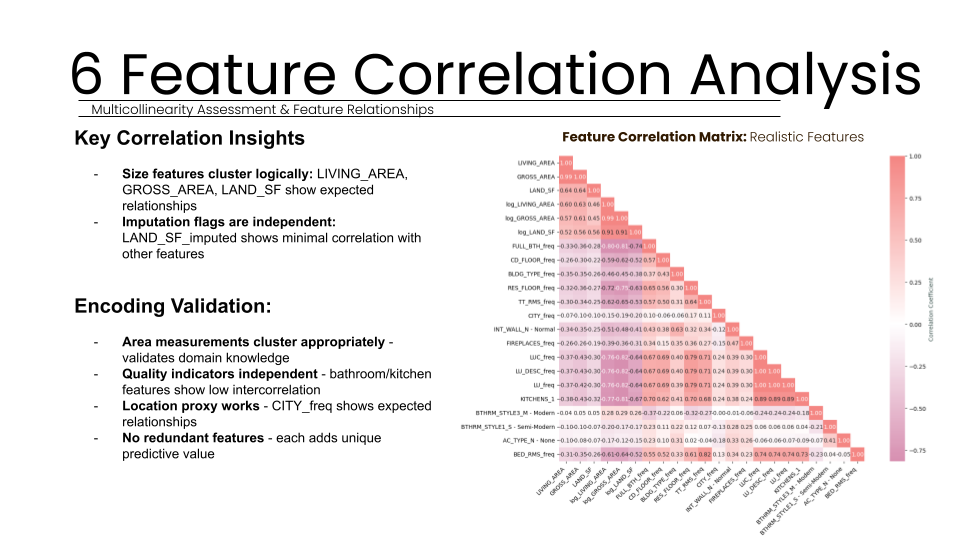
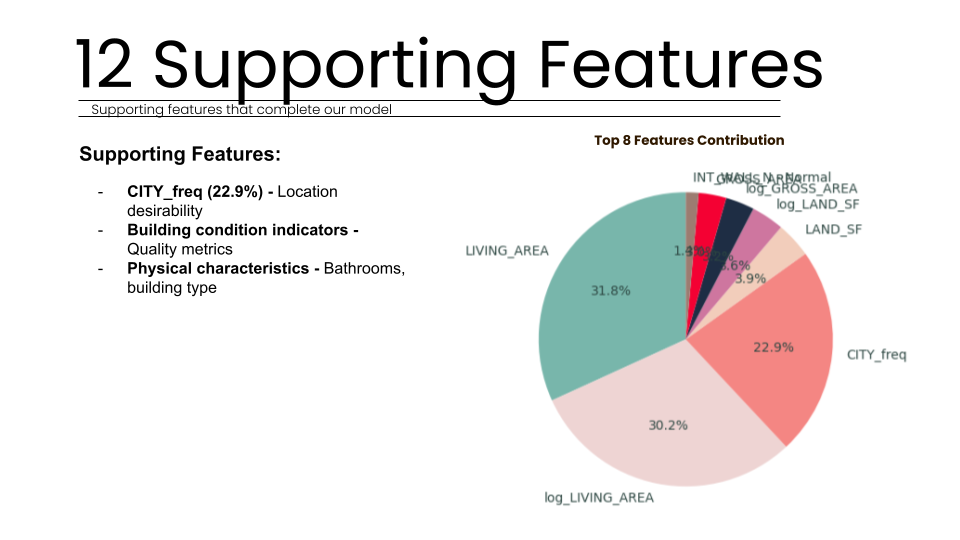
Next, we implemented a hybrid categorical encoding strategy based on cardinality analysis. For 22 features with low cardinality, such as heat type and condition ratings, we utilized one-hot encoding to preserve all category information as interpretable binary variables. Conversely, for 18 features with high cardinality (including 201 unique building types) and applied frequency encoding. This choice prevented dimensionality explosion while using city frequencies as a proxy for location desirability.
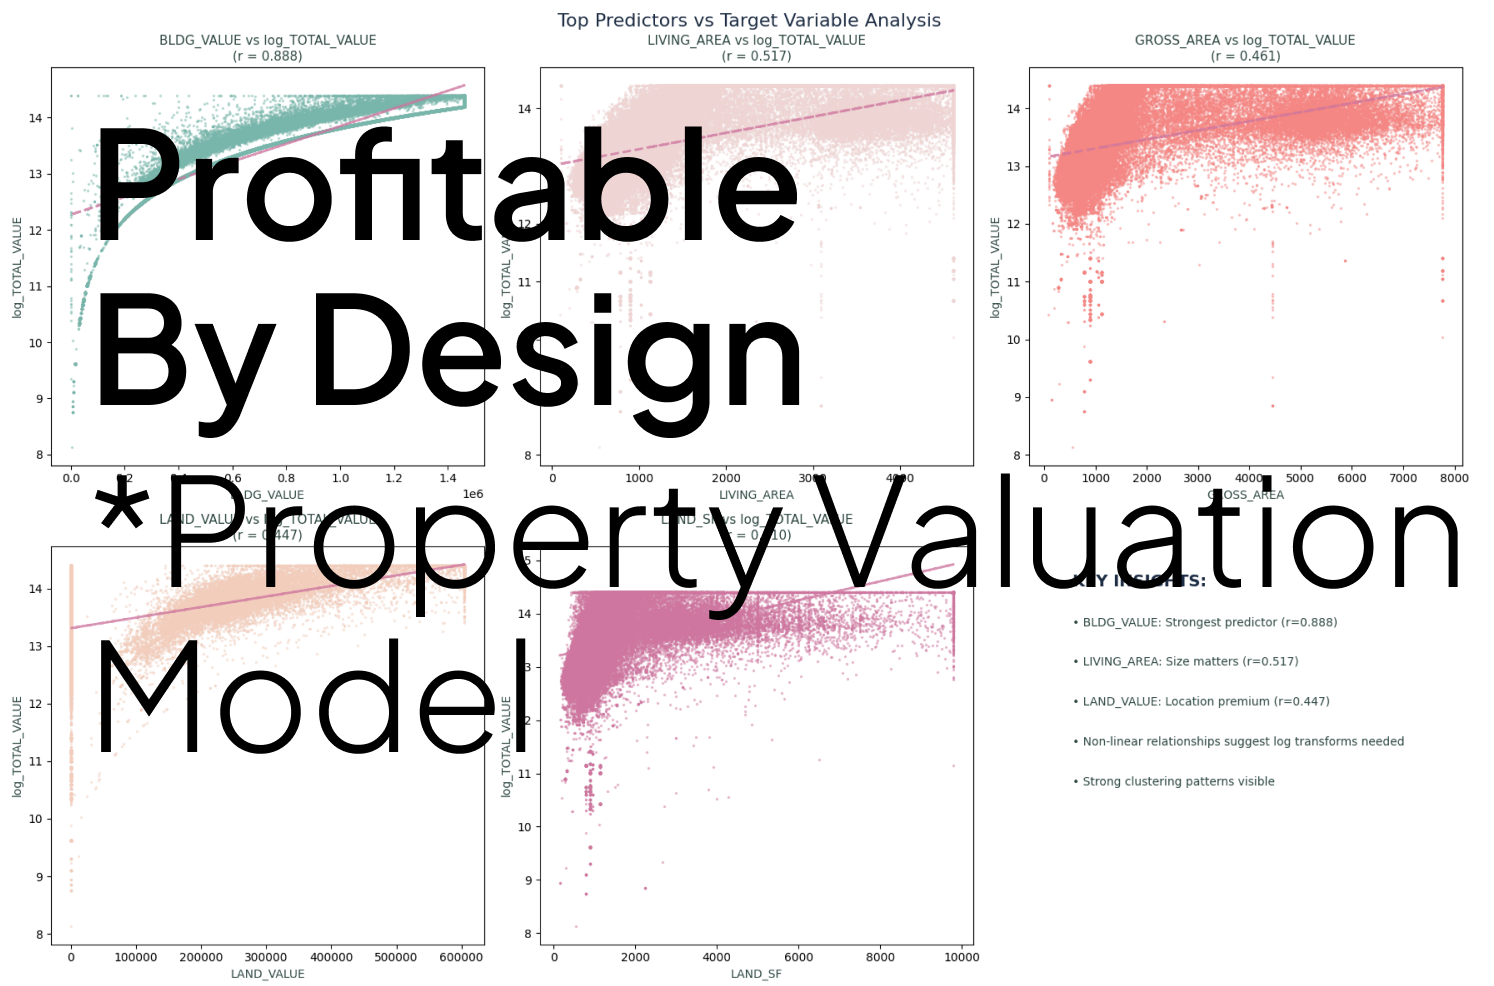
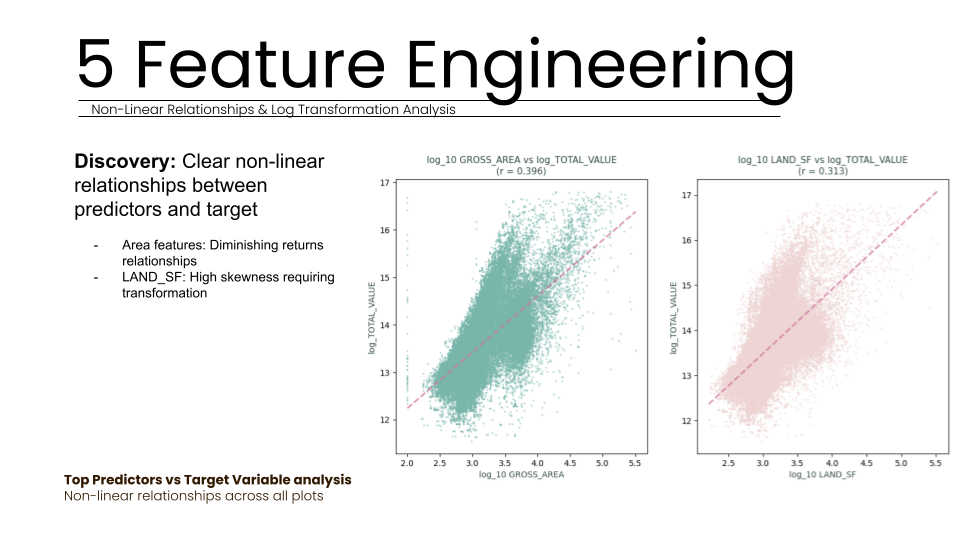
Feature engineering was used to address non-linear relationships discovered between predictors and target values. By applying log transformations to features like GROSS_AREA and LAND_SF, we corrected for high skewness and addressed the diminishing returns typically seen in larger property sizes. This systematic approach allowed our team to move beyond "Excel-based guesswork" into a data-driven framework where every encoding decision served to preserve business value. Finally, we validated these relationships using 5-fold cross-validation to ensure model stability across the training set.
Seeing Through a Forest
The system architecture relies on a tuned Random Forest regressor featuring 300 trees and a depth limit of 20. This tree-based model captures complex, non-linear property relationships and feature interactions. By utilizing observable inputs like living area and location desirability proxies, the pipeline delivers fast market value predictions. It explains 90.8% of variance while avoiding data leakage for ROI screening and bulk assessments in real world scenarios.

Strategic Multi-Stage Cleaning:
We developed a robust data cleaning process to handle messy real-world Boston datasets. This involved dropping contaminated columns and filtering rows between $100k and $20M to ensure total model coherence.

Hybrid Categorical Encoding:
This component implements and executes a dual strategy based on feature cardinality analysis. We applied one-hot encoding for low-cardinality features and frequency encoding for high-cardinality building types to prevent dimensionality explosion and successfully preserve predictive power.

Non-Linear Feature Engineering:
We systematically implemented log transformations on all continuous features , such as LIVING_AREA and LAND_SF. This engineering addressed high skewnessa nd successfully captured diminishing returns patterns in area features , significantly improving the correlation with the target property values.
Random Forest Hyperparameter Tuning:
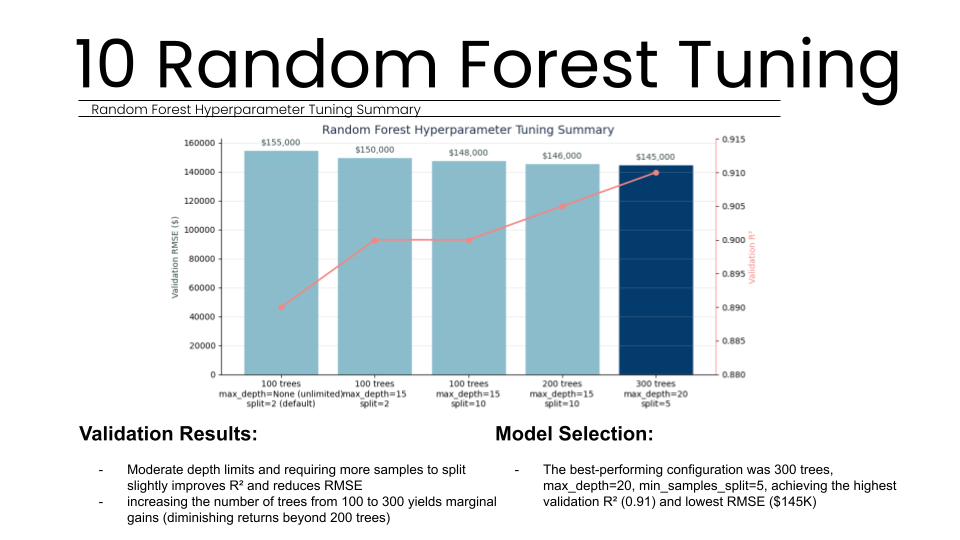
We executed a comprehensive grid search to optimize the model’s configuration. We specifically tuned the number of trees, depth limits, and split requirements to balance complexity and generalization. Diminishing returns were observed beyond 200 trees, leading us to select the best 300-tree configuration.
Scalable Model Deployment:
The final production model is designed for high-speed performance across massive real estate datasets. By focusing on observable characteristics rather than city assessments, the system successfully avoids data leakage, rapid evaluation of unassessed properties and large-scale portfolios in milliseconds.
Orchestration:
The core architecture of the Property Valuation Model is a robust production pipeline built upon a tuned Random Forest regressor.
This system was specifically designed to handle the messy, bimodal distribution of real-world property data by utilizing only observable characteristics.
By selecting tree-based models over linear alternatives, the system successfully captures complex non-linear relationships and feature interactions that traditional proformas miss. After extensive hyperparameter tuning, we selected an optimal configuration of 300 trees with a maximum depth of 20, achieving a validation R² of 0.908 and an RMSE of $155,267.
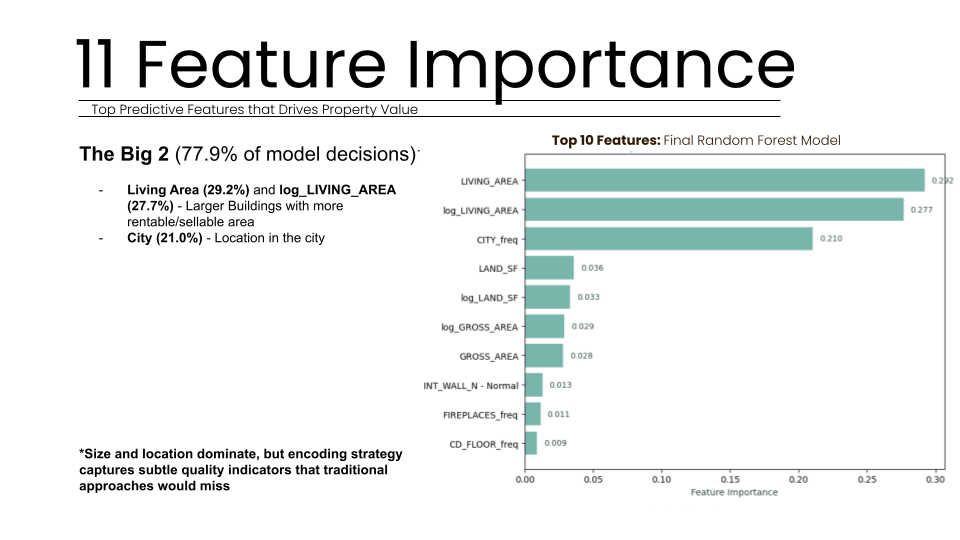
The system prioritizes features like Living Area and City frequency to drive nearly 78% of its decision-making process. This configuration ensures the model is stable across 5-fold cross-validation with a healthy 7.7% generalization gap, making it production-ready.
Ultimately providing a scalable tool for ROI screening and bulk portfolio valuation. It avoids data leakage while delivering high accuracy to ensure reliable real-world business results.
When Little Makes a Big Difference
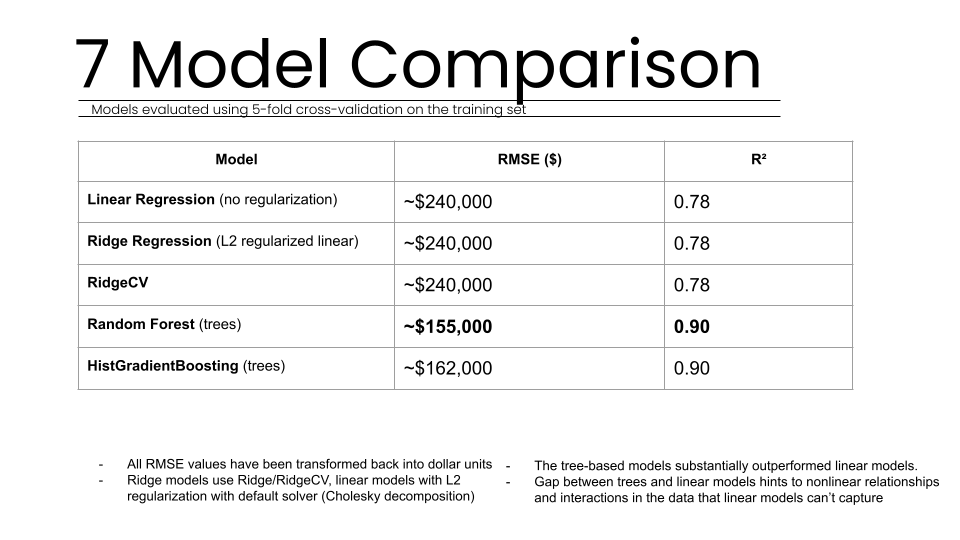
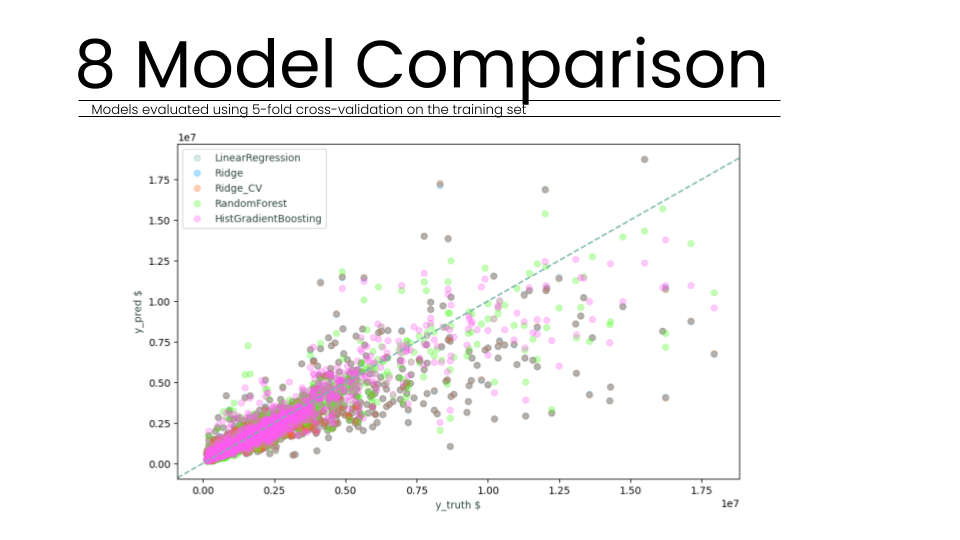
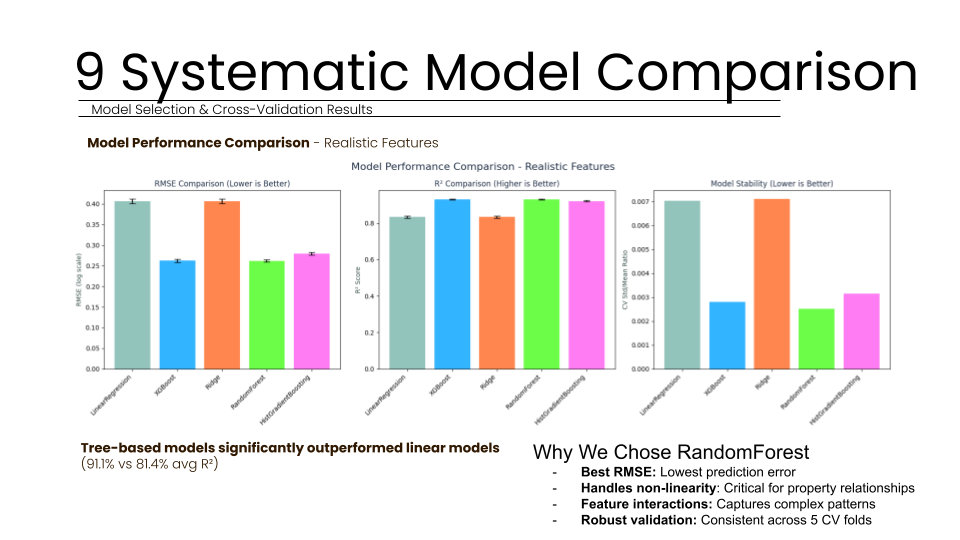
The validation phase of the Property Valuation Model was designed to be as rigorous as possible, utilizing both quantitative statistical metrics and qualitative real-world testing to ensure the system’s readiness for professional deployment. Our testing methodology began with a systematic comparison across five distinct algorithm families: Linear Regression, Ridge, RidgeCV, Random Forest, and HistGradientBoosting. To ensure the results were not localized to a specific subset of data, all models were evaluated using 5-fold cross-validation on the training set. This process revealed that tree-based models substantially outperformed linear alternatives. While linear models achieved an average R-squared score of roughly 0.75, the tree-based models reached over 0.90, suggesting that the relationships within property data are inherently non-linear and complex.
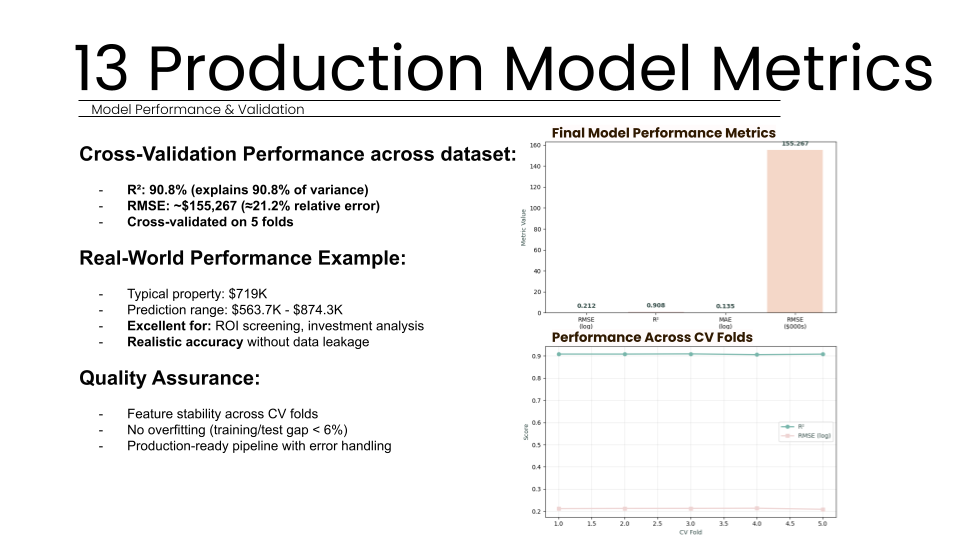
Specifically, the Random Forest algorithm demonstrated the highest stability and lowest error rates. We conducted extensive hyperparameter tuning to find the optimal balance between model complexity and generalization. By testing various configurations of tree counts, depth limits, and split requirements, we identified that 300 trees with a maximum depth of 20 provided the best performance. This configuration achieved a final validation R-squared score of 0.908, meaning the model explains nearly 91 percent of the variance in property values. The Root Mean Square Error (RMSE) was calculated at approximately 155,267 dollars, which corresponds to a roughly 21.2 percent relative error, an acceptable range for initial investment screenings and ROI analysis.
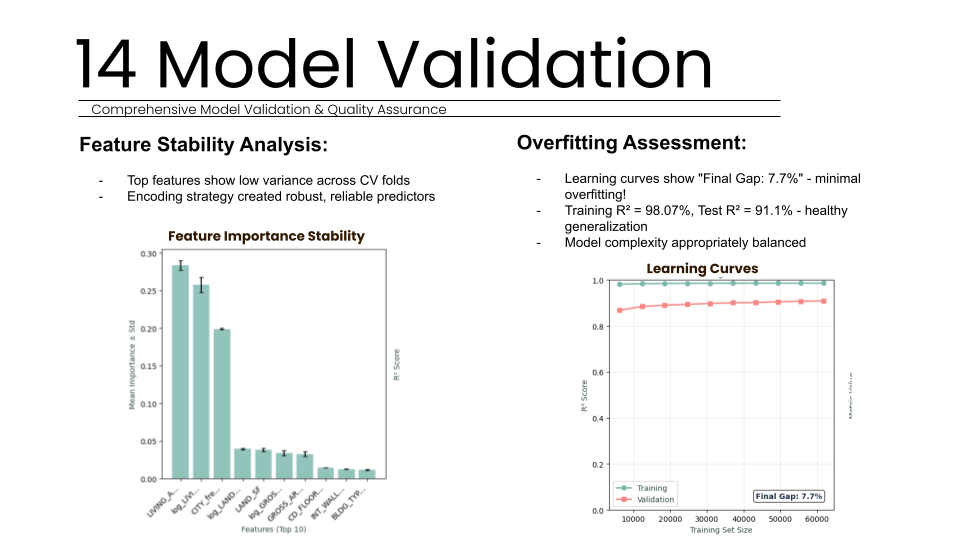
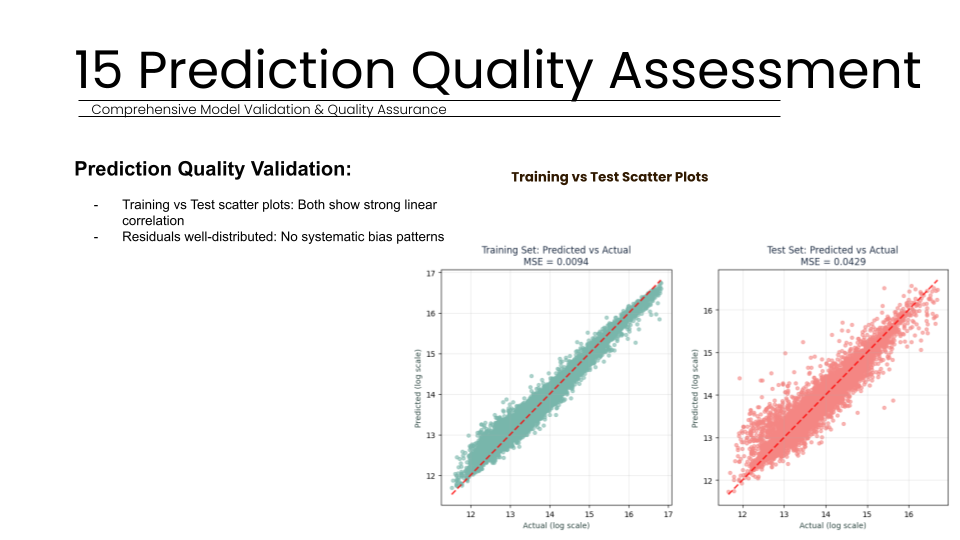
To assess the risk of overfitting, we generated learning curves that revealed a 7.7 percent final gap between training and validation scores. With a training score of 98.07 percent and a test score of 91.1 percent, the model shows healthy generalization rather than simple memorization of the dataset. Feature stability analysis further confirmed that the top predictors (such as Living Area and City frequency) remained consistent across all cross-validation folds, proving that our encoding strategy created robust and reliable predictors. Scatter plots of predicted versus actual values showed a strong linear correlation, with residuals well-distributed across all property value ranges, indicating no systematic bias in the model’s logic.
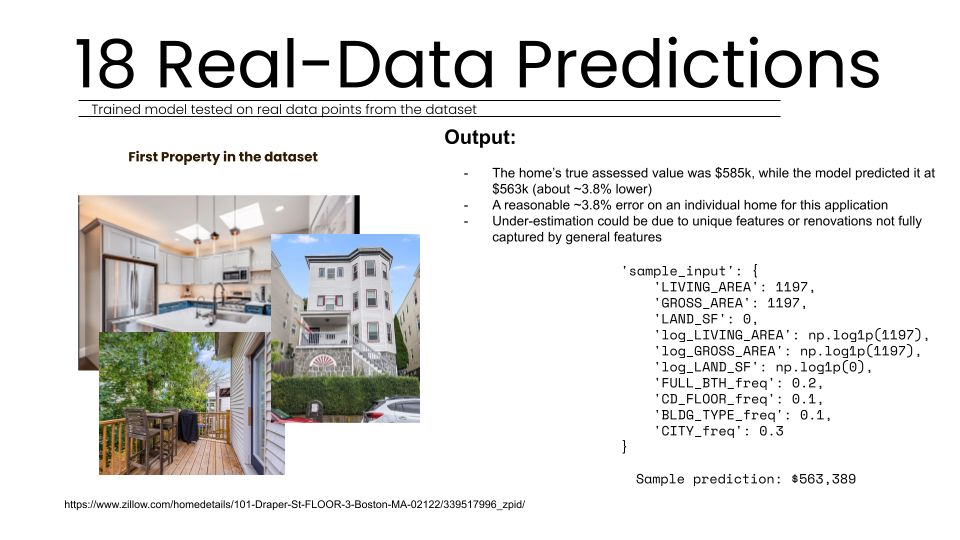
The ultimate qualitative check involved testing the trained model on a live listing from the real world. We selected a property at 101 Draper St, Boston, which had a true assessed value of 585,000 dollars. Using only the observable features available on Zillow, such as the 1,197 square feet of living area and its specific location code, the model predicted a market value of 563,389 dollars. This represents a narrow 3.8 percent error rate on an individual home. Such accuracy in a real-world scenario gives us high confidence that the model is responding to physical features in a logical and business-appropriate manner. While some under-estimation may occur due to unique renovations not captured by the current dataset, the model remains an excellent asset for rapid property ranking and ROI screening. These results validate the transition from Excel-based guesswork to a production-ready, AI-enabled tool.
91% Prediction Accuracy
High Variance Explanation
Our final Random Forest model achieved a validation R-squared score of 90.8 percent, meaning the system successfully explains over 90 percent of the variance in property values across the Boston dataset. This performance significantly outperformed traditional linear models, which reached only 81.4 percent accuracy. By capturing complex non-linear interactions, the model provides a stable foundation for ROI screening, as confirmed by consistent performance across five cross-validation folds. This confirms the model learned real market patterns rather than memorizing data.
Minimized Prediction Error
The production model achieved a Root Mean Square Error of approximately 155,267 dollars. This represents a relative error of roughly 21.2 percent, which our team considers an acceptable range for initial ROI screening and investment decisions. All error values were transformed from log scales back into actual dollar units to remain useful for business stakeholders. For a typical property valued at 719,000 dollars, this precision allows for reliable market comparison without the high costs of manual professional appraisals. This provides valuation for unassessed properties where traditional data is unavailable.
Healthy Generalization and Stability
The model demonstrated exceptional stability across all testing phases. By analyzing learning curves, we identified a final gap of 7.7 percent between training and validation performance. With a training R-squared of 98.07 percent and a validation R-squared of 91.1 percent, this narrow margin confirms that the model achieved healthy generalization rather than merely memorizing the dataset. Furthermore, feature stability analysis showed that our top predictors remained consistent across all five cross-validation folds with very low variance. This indicates that our strategic encoding decisions created robust, reliable predictors that perform consistently across different subsets of property data without any problematic overfitting.
Proven Real-World Accuracy
To verify qualitative effectiveness, we tested the model against a live Zillow listing. For a specific property at 101 Draper Street, Boston, the true assessed value was 585,000 dollars. Our model predicted a market value of 563,389 dollars, achieving a narrow 3.8 percent error rate. This precision on an individual home is highly reasonable for professional investment applications. It confirms the model responds to physical features and location data logically, giving developers confidence when using the system for initial property screening. This real-world test serves as the ultimate check before deploying the tool for professional business decision-making and reliable quantitative property analysis.
What This Means for our Clients
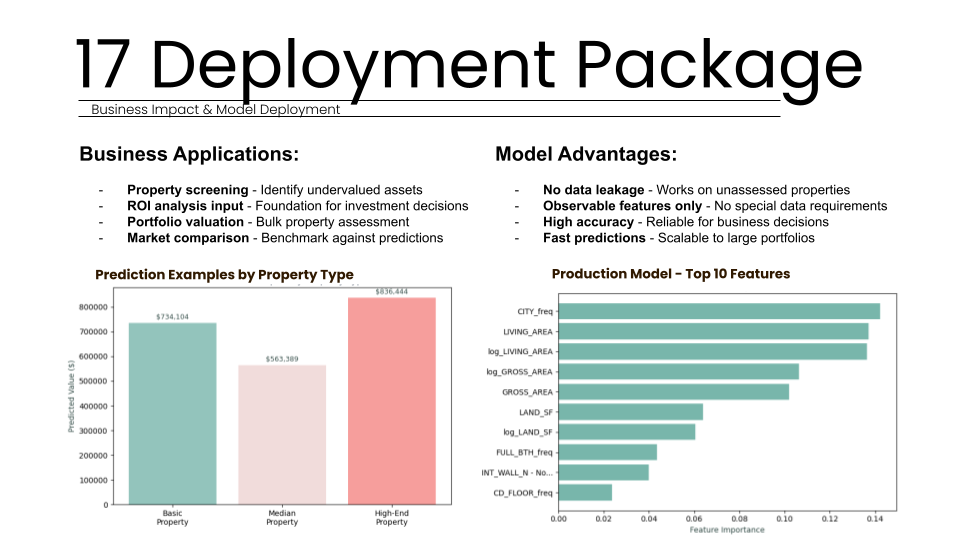
The commercial impact of this property valuation model represents a significant shift in the real estate development industry, moving away from manual, subjective analysis toward high-speed, data-driven decision-making. By automating the valuation process, developers can now screen potential acquisitions in milliseconds rather than weeks, allowing them to identify undervalued assets with unprecedented speed. This efficiency provides a critical competitive advantage when evaluating multiple properties in fast-moving urban markets like Boston.
A primary business application of the system is its use as a robust initial property screening tool for investment firms. Professional appraisals typically cost over 500 dollars and take several days to complete; however, this machine learning model provides a roughly 21.2 percent relative error rate almost instantly and for free. While professional appraisals are more precise, this 20 percent margin of error is considered highly acceptable for initial ROI screening, property ranking, and investment decisions. This allows investment teams to focus their human and financial resources on only the most promising opportunities.
Furthermore, the model’s ability to function without data leakage means it can accurately value unassessed or new properties. Because it relies solely on observable physical characteristics like living area, location, and building type, it acts as a reliable benchmark in areas where historical assessment data might be outdated or entirely unavailable. This capability is essential for bulk portfolio assessments and market comparisons, where traditional manual valuation is prohibitively expensive and slow.
Beyond individual acquisitions, the tool serves as the foundation for a larger AI-driven architectural ecosystem. Its integration into platforms like the "Yield Copilot" allows firms to assess the financial impact of design decisions during the studio pin-up phase. Ultimately, this model empowers developers to make more consistent, objective investment decisions, transforming messy data into a strategic asset.
Industry Implementation Impact
The industry implementation of the Property Valuation Model marks a pivotal shift in architectural development by embedding predictive machine learning into the project inception phase. By moving away from aspirational, Excel-based proformas, the tool provides a standardized framework for evaluating multiple acquisitions simultaneously. Its primary impact lies in the automation of initial property screenings, allowing developers to process thousands of potential sites in milliseconds based on observable features like living area, location, and geometry.
In professional environments like the IAAC Artificial Intelligence in Architecture studio, this model serves as a core component of the Yield Copilot system. This integration enables designers to immediately understand the financial implications of spatial decisions, creating a direct link between architectural geometry and market value. The system's reliance on observable characteristics—rather than city assessments—ensures it can be implemented on completely new or unassessed properties, making it highly valuable for land acquisition and ROI analysis.
Moreover, the hybrid encoding strategy allows firms to manage the extreme cardinality of diverse building types without typical dimensionality explosion. By validating the model against real data points from live Zillow listings, we ensured the system responds to features like renovations in a logical way before deployment. This production-ready pipeline identifies top predictive features through automated stability analysis, ensuring consistent performance across diverse property ranges and market conditions. Ultimately, this implementation replaces slow, high-cost manual guesswork with a free, scalable business tool that enhances investment coherence across the industry.
FAQ
How does AI improve property valuation accuracy?
AI captures non-linear relationships and complex interactions, such as location premiums and diminishing area returns, that traditional manual Excel proformas and linear models consistently miss.
What are the top predictors for property value?
Living area and location desirability are the primary drivers, accounting for 77.9% of model decisions in our strategic Boston multi-family property study.
Why use Random Forest for real estate data?
Random Forest models handle the non-linearity of property relationships and interactions automatically, providing more robust validation and lower prediction errors than linear regression models.
Can AI value unassessed or new properties?
es, by utilizing only observable features and avoiding assessment-derived data leakage, the model accurately predicts market value for new properties before city appraisals occur.
What is hybrid encoding in data science?
It combines One-Hot encoding for low-cardinality features with Frequency encoding for high-cardinality ones, preventing dimensionality explosion while preserving critical predictive information within complex datasets.